Tag Archives: bestpractices

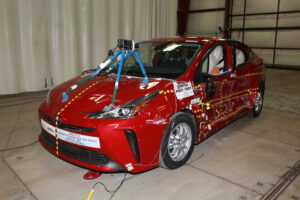
How Much Safer are Vehicles that Pass the Updated IIHS Side Impact Test?

Side impact crashes are the most deadly per mph of impact speed; we need better tests to better evaluate our risks.

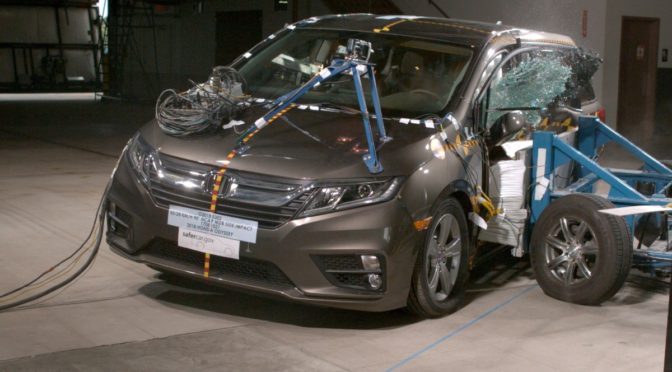
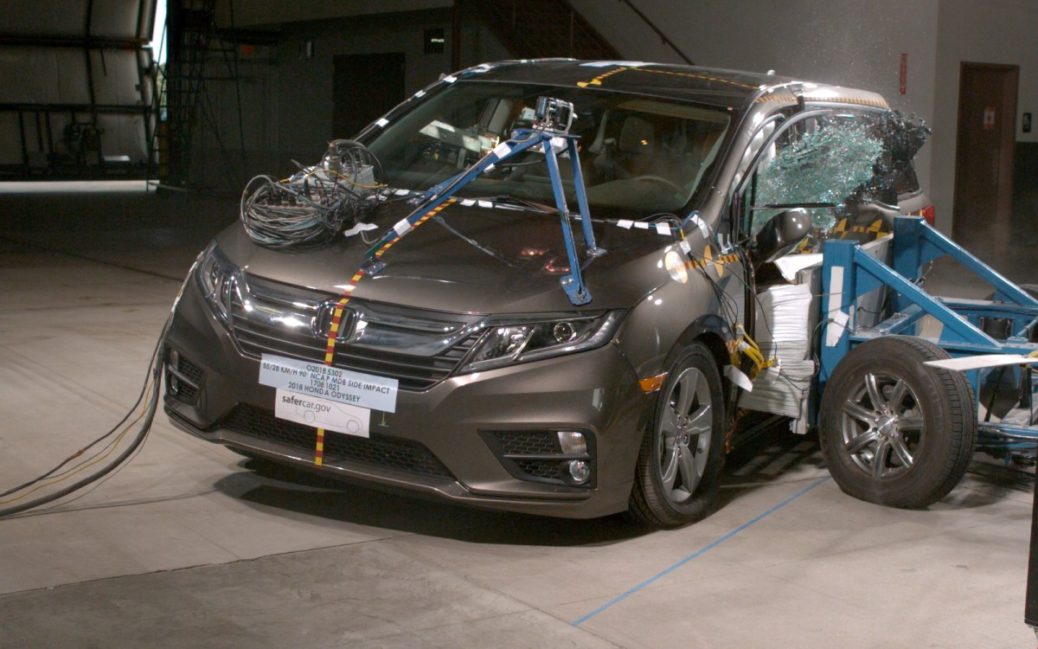
A few years ago, I wrote about how the IIHS had begun to design a replacement side impact test to address some of the shortcomings I’d identified in the original test. In particular, I hypothesized that the IIHS’ threshold for a “good” level of structural impact resistance–at least 12.5 cm of space between the B-pillar and the centerline of the driver’s seat after impact with a 3300 lb barrier traveling at 31 mph–was not enough to keep occupants safe. I based my hypothesis on the various case studies I’d profiled involving frontal and side impacts as well as on calculations of kinetic energy changes across impact speeds (for example, the fact that a head-on crash at 55 mph is the equivalent of being pushed out of the 10th floor of a building).

My theories led me to write a range of articles illustrating the leaders in side impact resistance across vehicular classes, from small- and mid-sized cars to station wagons to minivans to SUVs. As the years progressed, the centerline distance increased with each generation of vehicles tested by the IIHS, reflecting improvements in engineering in new vehicles throughout the country and greater attention paid to side impact safety. I’m happy to say that the day has arrived!

The IIHS modified their side impact test in late 2021 as they acknowledged that high speed side impact crashes still caused a significant number of fatalities in vehicles with “good” side impact scores. What were the changes, and how much of a difference are they likely to make? We’ll take a dive into these questions below, and as usual, the emphasis will be on best practices, and not simply on a blind trust that institutional standards are good enough, because as we’ve learned through decades of public health failures (leaded gasoline, CFCs, asbestos, auto safety, opioids, climate change, and most recently, the COVID-19 pandemic), institutional standards are almost never where they need to be.

What changes did the IIHS make to their side impact crash test?
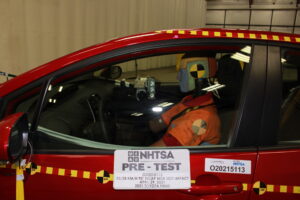
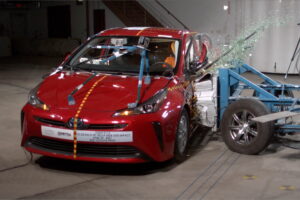
The main changes the IIHS made to the side impact protocol involved barrier mass, velocity, height, and contact surface. Two of these changes were good. Two of these changes were not necessarily good ones.

The barrier mass change was a good one; the weight was increased from 3,300 pounds, or that of a mid-sized car or small SUV, to 4,200 pounds, or that of a large car, mid-sized SUV, or minivan.

The velocity change was a good one; the barrier contact speed was increased from 31 mph to 37 mph.

The contact surface change was not a good one in my books. Per the IIHS; it was softened in order to permit it to bend around the B-pillar in order to compromise occupant space by the front and rear doors despite the presence of a strong B pillar. However, when discussing the limitations of the original side impact test, the IIHS also directly admitted that in real-world crashes, vehicles of a given weight produced more damage due to less forgiving (read: stiffer) fronts than the deformable barrier, which acted somewhat like a pillow when impacting the tested vehicles.

The increased danger of rigid barriers is highlighted well in the NHTSA side pole test, in which a vehicle is driven sideways at a 75 degree angle and at 20 mph into a rigid pole 10 inches in diameter; this is designed to simulate a telephone pole or tree strike.  While the IIHS claims that their original and side tests result in more damage than this test, I completely disagree, and find both tests complement each other. The NHTSA test is a frightening one, as the intrusion is tremendous despite the relatively low speed; it is easy to see how such a crash could and would result in fatal cranial trauma despite the low speeds, and it provides all the evidence necessary that rigid barriers, pound for pound, are far more threatening than deformable ones.

Similarly, the height change was not a good one in my books. The IIHS lowered the height of the barrier under the argument that a lower barrier would better replicate the damage of an SUV strike than that of the prior barrier. I’m not a fan of it because it reduces strain on the B pillar and threats to driver’s heads (as represented by HIC-15 forces) by concentrating striking forces closer to the ground where the vehicle is stronger, rather than toward the cabin, where everything we value is located.

How do IIHS side impact crash test changes translate to real world safety differences?
This is where things get interesting; we’ve seen the science, but now we need the engineering. When I wrote about the limitations of the original IIHS side impact test, my wish list included a 4,000 pound barrier and a 40 mph impact speed. I got a little of both; the barrier mass exceeded my expectations but the impact speed fell below them. Unfortunately for us, the impact speed matters more. Let’s look at the math.

To calculate the test forces, we’ll use kinetic energy = 1 / 2 * mass * velocity * velocity.

The original test featured k = .5 * 1497 kg * 13.9 m/s * 13.9 m/s, or 143.7 kJ, or kilojoules of energy.

Per the IIHS, real world studies indicate that drivers of vehicles with “good” scores on the original test are 70% less likely to die from direct side impacts vs drivers of “poor”-rated vehicles. This advantage drops to 64% with “acceptable” vehicles and 49% with “marginal” vehicles. These are, frankly speaking, great advantages. But where are we going now?

My wish list test of 4,000 pounds and 40 mph results in 290.1 kJ. This is 202% as much force as that in the original IIHS test, or 102% more.

The new IIHS test at 4,200 pounds and 37 mph results in 260.6 kJ. This is 181% as much force as that in the original IIHS test, or 81% more. The IIHS lists it as 82% more, so we’re in the same range.

However, notice the difference between my wish list and their revision: although they added more weight than I was hoping for, the fact that they only boosted speed by 6 mph instead of my 9 mph to hit an even 40 mph means a test that’s significantly less impactful, if you’ll excuse the pun. As we’ve discussed over and over and over again, speed matters more than almost anything else. A 4,000 pound vehicle traveling at 40 mph will do significantly more damage than a 4,200 pound vehicle traveling at 37 mph.

That said, it’s still worth celebrating that the IIHS is using a test that’s more reflective of real world crashes. It is significant (and disappointing), however, that they chose a lower speed to give car manufacturers an easier time to meet the new standard instead of pushing them to do more and save more lives by putting more effort into high end engineering. Forty miles per hour is a natural testing speed upgrade; it’s what the IIHS uses universally in frontal crashes. The main reason to avoid using such a speed in side crashes is because it’s much harder to engineer a vehicle that will let you walk away from a 40 mph side impact than it is to engineer one that will do the same with a 40 mph frontal crash, as there is far less space between the driver and the barrier in a side impact crash than there is in a frontal crash.

Is it worth buying a vehicle tested under the new standard if I already have a “good” vehicle under the old side impact test?

This is perhaps the most difficult question of all to answer. It really depends on your risk tolerances and budget. Personally, if I had a vehicle that already tested well on the original IIHS test, I would not rush to upgrade in order to get the newer technology. It’s absolutely an improvement, but if you’ve got a vehicle with “good” scores on the old test, you almost certainly have a vehicle that has the other essential elements in vehicular safety: good frontal scores and ESC. If you’ve got these, your vehicle is good enough, and you’ll get far more out of focusing on how you’re driving and on where you’re driving. These are the main factors in whether or not you make it home, especially once you have a decent vehicle.

If you find my information on best practices in car and car seat safety helpful, you can buy my books here or do your shopping through this Amazon link. Canadians can shop here for Canadian purchases.  It costs nothing extra to do so, but when you shop through my links, a small portion of your purchase, regardless of what you buy, will go toward the maintenance of The Car Crash Detective.

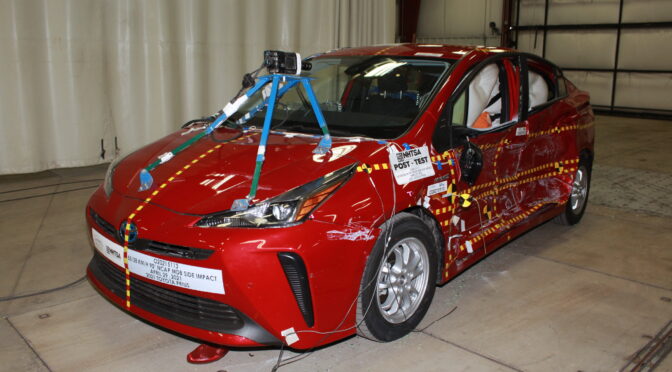
IIHS Acknowledges Side Impact Test Limitations Identified Years Earlier on CCD

Side impact crashes are often fatal. We need more realistic tests to design more resistant cars.

One of the most consistent messages I’ve tried to share on the CCD since its creation has been for the need to identify best practices and execute them without waiting for institutions to acknowledge them. This is a song and dance we see time and time again, such as in our national approach to car seat safety. The American Association of Pediatrics most recently recommended in 2011 rear-facing children until the age of 2, marking a major increase over the 2002 recommendation of doing so until 1. The problem, of course, is that best practices as outlined in Sweden recommend rear-facing until 4 or 5, and have done so for more than 40 years. In other words, our latest policies in car seat safety are still behind where the Swedes were 40 years ago. This, incidentally, is a major part of why we continue to lose about 5 children to auto trauma in the US for each child lost in Sweden. To follow best practices, you can’t wait for your government to learn they exist, never mind to put them into law. Unfortunately, the knowledge and enforcement falls on you. Let’s look at how this applies today to an area of interest of mine: side impact collisions.

Vehicular safety is only a third of the road safety picture, but it’s still worth talking about

The scene is no different when it comes to vehicular safety. Even though it’s only one third of what actually matters in road-related best practices (along with driving behaviors and road infrastructure, which make far more of a difference than vehicular design), it’s still significant. We know that of the three main types of multi-vehicle collisions–frontal, side, and rear–that side impacts have the most severity and are the most likely, crash for crash, to result in fatalities. This is why nearly every article I’ve written on vehicular safety in multi-vehicle contexts has had to do with the vehicles that have tested best in side impact crash mitigation. The theory I developed some years ago was that, while the IIHS’ threshold for a “good” level of structural impact resistance–at least 12.5 cm of space between the B-pillar and the centerline of the driver’s seat after impact with a 3300 lb barrier traveling at 31 mph–was acceptable, it wasn’t enough. I wrote article after article illustrating the leaders in side impact resistance across vehicular classes, from small- and mid-sized cars to station wagons to minivans to SUVs. Here they are below:

My theories were based on the crashes I’d studied involving side and frontal impacts as well as an understanding of the dramatic increases in kinetic energy present with slightly higher impact speeds (which we’ve also discussed extensively throughout the blog).

What did the IIHS learn about their side impact test?

This is where the IIHS comes in. They noticed (as has anyone paying any amount of attention to crash statistics) that people continue to die in side impact collisions despite increasing market penetration of well-scoring vehicles. While cohesive, long-term solutions would not solely focus on strengthening vehicles but on producing safer drivers and roads that prevented or reduced the risks of side impact collisions, the IIHS, by design, focuses nearly exclusively on vehicle design. On one hand, this severely limits their effectiveness. On the other, every bit of the puzzle helps. This, by the way, is one of the many reasons why it’s so important for them to not hide internal crash data any more than they already do. Here’s what they found:

IIHS researchers conducted another study of real-world side crashes. This time they examined how well each of the test measurements that feed into the ratings correlates with death risk.

The study included 1999-2016 model year passenger vehicles with standard head-protecting side airbags that had been rated by IIHS for side protection. The researchers looked at the rate of driver deaths per left-side crashes for each model. They compared these rates with 10 specific intrusion and dummy injury measures that go into the ratings, finding that each one was correlated with driver death risk in left-side crashes.

For example, the authors estimated that each additional centimeter of B-pillar intrusion was associated with a 3 percent increase in death risk. Each additional millimeter of rib deflection, one of the measures recorded by the dummies in the test, was associated with a 1 percent increase in death risk.

The key part is in blue above. The researchers were simply interested in the validity of the test itself–whether the measures the ratings were based on were related to real-world death risks. They were, but in particular,they also found direct correlations between tested side impact intrusion and risks of death in real-world crashes.

We came to this conclusion several years ago–lower intrusion, greater survival

The annual CCD budget is much smaller than that of the IIHS, as I don’t have an army of insurance companies funding my work. If I did, I’d focus far more on best practices while leaning on the shoulders of giants–Swedish and otherwise–instead of on retesting policies and practices leaders in the field established years ago. However, we are where we are, and the good news is that the IIHS is planning on designing a more stringent test for manufacturers. It’s just worth noting that, as is often the case, you can’t wait for corporations to come to logical conclusions related to public safety and health: if you’ve got access to better information or the ability to generate such information on your own, use it. Share it. By the time the corporations come to the same conclusions, you’ll be around to enjoy them, and more importantly, you’ll have improved the quality of life for a number of people you may never meet but with whom you share this great big world.

What will the IIHS and car manufacturers learn from the new test?

Here’s a look into the future:

If the test is meaningful, most vehicles will fare poorly at first, because it will reflect a more realistic crash environment–the one that leads to all the real world deaths in vehicles with currently good side impact scores. If the test is not meaningful, most vehicles will do well, and we will learn nothing.

This isn’t school. The fact that vehicles pass with flying colors from the start is meaningless if people continue to die in massive numbers. A meaningful test will need to be one that simulates real world conditions. I’d personally like to see a test speed of at least 40 mph–the same speed used in their frontal collision tests–and a vehicular mass of at least 4,000 pounds, which is far more representative of the average SUV, minivan, or pickup on the road than 3,300. They note themselves in a related study that the average 2019 model year SUV weight was 4,200 pounds, which they used in a small series of tests to see if there were differences in how vehicles responded when impacted by real vehicles compared to when they were hit by the test deformable barrier. Incidentally, they discovered there that real vehicles of a given weight produced more damage due to less forgiving (read: stiffer) fronts than the deformable barrier, which acted somewhat like a pillow when impacting the tested vehicles. Clearly, they have more work to do. But the key point to take home regarding the redesigned test is that if it doesn’t represent the types of crashes I write about on the CCD–those at highway speeds with heavy vehicles–it isn’t going to teach us anything or lead to safer vehicles.

Does this mean I need a vehicle that shows up on your lists, Mike?

No, no, no.

Such vehicles are ideal if you can get them, but in the end, this still isn’t what makes the lion’s share of difference in whether you’ll make it home to your loved ones each night. Focus on your driving–how you do it and where you do it. That’s where up to 90% of the results will come from. What you’re driving may make up the last 10%, and I think that’s generous. Remember–in a 70 mph head on collision (whether with another vehicle or with a bridge or home-like barrier), you’re facing 306%, or more than 3 times, the force that your vehicle was designed to protect you from ((70)^2/(40)^2). Statistically speaking, everyone in your car, minivan, SUV, or pickup is going to die. I’ll repeat that once more because it’s such a key point to remember.

No matter what you drive, you won’t survive past a certain collision speed

That speed will vary with a number of factors, but it’s almost always going to be hit by the time you reach 70 mph. It’s often hit at far lower speeds, like at 55 mph. Remember, that’s as severe of a crash as being pushed off a 10th floor parking garage while strapped into your car.

Learn, then follow best practices. Everything else is fluff.

If you find my information on best practices in car and car seat safety helpful, you can buy my books here or do your shopping through this Amazon link. Canadians can shop here for Canadian purchases.  It costs nothing extra to do so, but when you shop through my links, a small portion of your purchase, regardless of what you buy, will go toward the maintenance of The Car Crash Detective.
Car Ferry Safety: Engines Off, Brakes Set, Passengers Out

Car ferries are a safe way to transport cars. But to follow best practices, you need to get out of your car while the ferry’s in open water.

I’ve written about car drownings before (in Florida, as is the case here, in New York, and in Oregon). If you die due to road trauma in the United States, statistically, this isn’t how it’s going to happen. But alongside dying in a crash-generated fire, deaths by water immersion are surely among the most feared ways of death involving motorized traffic. There’s a reason these stories make the news and have more staying power than “normal” crashes. If you’re going to die, you want it to be quick. Drowning and burning to death are not, compared to the agony they inspire.

Unfortunately, Emma Afra, 65, and Viviane Brahms, 75, suffered such a death on February 18th, 2020, around Fisher Island, Florida,  close to Miami Beach, when Emma accidentally drove their blue 2019 Mercedes-Benz car off the back of the Pelican car ferry they were traveling on and into the waters below. Let’s unpack what happened, how it could have been prevented, and what best practices look like involving car ferry safety.

How did Emma and Viviane die?

Per witness reports, Emma did not set the parking brake in her vehicle during the voyage and at some point (close to 5 PM local time), pressed the accelerator. She drove through the netting on the back of the ferry, entered the water, and the vehicle sank soon after. She and Viviane were found that evening hugging each other in the back seats of the car. The car was upside down on the bed of the ocean floor at a depth of 52 feet. The cause of death was almost certainly drowning.

Once in the water, is there any way they could have survived?

In every immersion case, we talk about how they entered the water and how the moment of leaving land (or in this case, a ferry) could have been prevented, but it’s also worth discussing if anything could have been done once the vehicle entered the water. The answer is different in every case, but the primary factors are almost always the situational knowledge of the individuals in the vehicle, the physical and mental conditions of the individuals and the rate, condition, and positions in which the vehicle in question impacted the water. Or to put it simply, your survival in an immersion situation depends on your understanding of how to leave the vehicle and how much time you have to do so, your fitness levels, and the way you hit the water. Let’s take a look at what happened with Emma and Viviane.

Given the relatively low freeboard, or deck height relative to the waterline, most of the velocity of the vehicle would have been horizontal (that spent driving off the deck) rather than vertical (that spent falling into the water). Similarly, images of the ferry shortly after the immersion suggest the vehicle would have had one length of driving room in front of it at most before leaving the deck, which also suggests a low entry speed. To put it bluntly, they would not have hit the water at a speed fast enough to severely injure or incapacitate them (remember that a 10th story fall is equivalent to a 55 mph crash), as long as they were wearing seat belts. The moment they entered the water, the clock started ticking. A car typically takes about 30 to 60 seconds to sink. They would have had to unbuckle themselves, wind down windows (remember that power windows will work for at least a few minutes in an immersion situation) or break them if they could not wind them down, and swim out. There are no other correct answers for survival unless they happened to have personal flotation devices within reach.

Calling for help would not have worked–not with their voices, not with their cell phones. Waiting for rescue would not have worked–not until they were outside the vehicle and treading water or swimming at the surface. Waiting for the vehicle to stop sinking (i.e., to touch the sea bed) in order to open the doors and swim out would not work because most people are psychologically and physically incapable of swimming 50 feet underwater on a single breath (especially in light of the fact that more than half of all Americans don’t have basic swim skills).

The moment they entered the water, they had to unbuckle, break or wind down the windows, and swim out. They had 30-60 seconds to do so. They could not. Most people, incidentally, would be unable to, because the vast majority of people would spend that survival window panicking, freezing, or calling for help. It’s a situation very, very few people are prepared for–even under ideal conditions (i.e., with low speed water entries, a lack of injuries, a lack of children or seniors, calm waters, warm waters, and daylight).

What are best practices for using car ferries safely?

The facts are sobering. Most people immersed in water deep enough to fully submerge their vehicles will drown, because they will lack the knowledge of what to do and the physical and mental abilities to do it. Only a small percentage will drown because their vehicles were so damaged escape was impossible or because they lost consciousness at impact. Statistically speaking, you’re going to freeze, panic, and drown.

With that in mind, the proverbs about ounces of prevention being better than pounds of cures are our best defenses, as they are in every high risk environment. I’ve gone on and on about how the way we drive and the places in which we drive matter far more than the vehicles we drive, and this is why: once you’re in the crash, things are out of your hands. Everything leading up to the crash is within them. You choose the roads you drive on, the speeds you use, the seat belts you attach, the car seat stages and orientations for your children, the lights you turn on, the tires you put on in the winter, and so on. All of these factors are designed to help you avoid crashes in the best scenarios and reduce injuries in the worst ones. When it comes to immersion situations, the immersion is the crash, and it’s almost always going to be a fatal one. The only winning move is to avoid it entirely.

How do you do that?

Here’s how you keep your car from driving or rolling over a car ferry deck with your loved ones inside

Well, if you’re on a car ferry, at a minimum, set your parking brake. This is the absolute least you can do, because just about every car can and will override the parking brake if the accelerator is pressed hard enough. And once you leave the deck, you’ve practically signed your death warrant, as well as those of every other occupant in your vehicle. So the parking brake isn’t good enough.

So shift your car into park along with setting the parking brake. This way there’s no possible way to drive into the ocean under your own power as long as you don’t shift out of park. The parking brake is still set to keep you from rolling off the deck if you shift into neutral. But this still isn’t good enough, because you might hit the shifter, or someone else (a child?) might bump it. And it would be no less tragic to die because you bumped out of park and didn’t know it than it would be to die because you hit the gas instead of the brakes. So the parking gear and brake aren’t good enough.

How about turning your engine off entirely? Now we’re starting to make some real moves–keeping in mind that you still are keeping your car in park while the parking brake is engaged, for reasons described above. A car in neutral, after all, doesn’t care whether the engine is on or off. But what if the ship starts to pitch and sway in rough weather? Cutting the motor, setting the parking brake, and keeping it in park isn’t good enough.

At this point, you might realize that nothing involving the vehicle itself is good enough. You can add wheel chocks, but those can move, particularly if the deck is getting sprayed with water while the ship is pitching back and forth. Chaining the car is even better, but it requires a ferry service with such resources and a policy of using them. So why don’t we skip all the way to the sure-fire, most effective solution?

Get out of the car until the ferry is docked

Best practices tend to be simple on a conceptual level. The hard part is following through. Nothing above is nearly as effective as the line you just read in bold. Get everyone out of the car and wait in the cabin with the crew, or in whichever waiting area they use for clients. The ferry doesn’t have one? Then that’s not a ferry worth taking. Respect yourself and your loved ones. Just get out of the car. Unless the entire ferry goes down (and if it does, you’ll likely have a chance to put on life preservers before it does), the ship itself is the safest possible place you could be. Not your car. Not your car. One more time for emphasis–not your car.

It might seem silly for a 10 to 15 minute ferry ride, especially if you have multiple children to unbuckle. Especially if you have infants. But the additional 5 minutes of hassle are much, much cheaper than the dozens or hundreds of years of life you and your vehicle’s occupants will lose if you find yourself rolling off the ferry because you didn’t want to get out of your car. Sometimes time is cheap, like when you’re leaving your car to wait in a cabin while on a car ferry. Sometimes it’s deathly expensive, like when your pilot gets lost in the fog and is about to crash into a hill and kill everyone onboard, or when you drive off a ferry and realize you only have 30 seconds to do your best NAVY SEAL impression for you and five other people in the second and third rows.

Put the odds on your side; don’t pitch yourself hopelessly against them. Best practices are best followed before they’re needed.

If you find my information on best practices in car and car seat safety helpful, you can buy my books here or do your shopping through this Amazon link. Canadians can shop here for Canadian purchases.  It costs nothing extra to do so, but when you shop through my links, a small portion of your purchase, regardless of what you buy, will go toward the maintenance of The Car Crash Detective.
Car Crashes Kill More Children than the Flu, or Keeping Influenza Dangers in Perspective

He may not like the flu shot. But it keeps him safe. And he’s at a much lower risk of death from the flu than he is from a crash.

Part of making informed decisions as a parent is making sure you’ve got the information in hand before you make the decision. Today we’ll talk briefly about two significant threats in children’s lives in the United States: road trauma, or car crashes, and the flu, or the influenza virus. One of these threats is more insidious, while the other is more temporal.

We hear about the dangers of car crashes fairly often, but for a variety of reasons, including our country’s tacit acceptance of the risks of driving as inevitable and immutable, we don’t pay much attention to them unless they involve us, people we know, or stores that receive high amounts of coverage on the nigthly or online news (e.g., the death of Princess Diana, which actually led to increases in suicides among women who self-identified with her). The flu, on the other hand, is generally ignored for about half of the year and thought of significantly during the other half, particularly when school-aged children attend public school systems or when news reports announce spikes in infection, hospitalization, or death rates.

However, as a reader of the CCD, you’re well aware that not everything that receives media attention is worth its coverage, and that a great many things ignored by the general population may be essential to our well being. Let’s take a quick look at the relative risks of children dying from road trauma (car crashes) vs the flu (influenza). The summary is that your child is around 4 times as likely to die from a motor vehicle during the flu season months (October to May) than she is to die from the flu, and that this rate balloons to 6 times that of the flu if the total number of child car deaths is compared to the annual total of flu deaths.

How many children die from the flu in the US in a typical year?

While the number of child influenza deaths reported to the CDC vary significantly from year to year (e.g., 110 in 2016-17, 188 in 2017-18, 144 in 2018-19, and 105 as of February 21st, 2019 in the 2019-20 season), the number lately has fallen between 110 and 188. Let’s use last year’s total of 144. Let’s also keep in mind that the flu season is generally acknowledged as spanning October through May, or 8 months (2/3rds) of the year.

How many children typically die from car crashes in the US in a typical year?

From a recent article, we know that 880 children under 13 died in 2018 from road trauma; this figure also floats up and down from year to year, but has generally ranged between a high of 1033 in 2016 and a low of 875 in 2014; every total since 2010 has fallen between these two boundaries.

Which is more dangerous, the flu or car crashes, for the average American child?

Comparing the numbers makes it clear that, while both of these dangers are meaningful, one poses far more of a risk, statistically speaking, than the other. When prorated by 2/3rds to represent the 8 month flu season, a child was approximately 4 times as likely to die from car crashes (880 * 2/3 = 587) as she was from the flu (144) in 2018. When the full tallies of both risks are compared, the same child was more than 6 times as likely to die from road trauma as she was from influenza.

This does not mean that the flu is not dangerous. It is. It kills tens of thousands of adults each year in the United States and a good 100 or more children die needlessly each year as well.

This does not mean that flu vaccines are unnecessary. They are. Vaccines overall are among the most important inventions we’ve ever come up with as human beings. I absolutely recommend the flu vaccine for children. Even if they end up with flu-like symptoms or infections, they’re significantly less likely to suffer severe symptoms or complications. This is basic information, but it bears repeating, especially since there’s a strong anti-intellectual streak running through the country with anti-vaccine propaganda leading to decreased immunization rates.

However, with all that in mind, the flu is not the bigger risk of the two for the vast majority of children in the United States (or around the world). Road trauma is. Six children die in the United States due to car crashes for every child who dies due to flu complications.

How do we protect our kids from the flu and from car crash fatalities?

To reduce your risks of flu illnesses, vaccinate your children. Beyond that, teach them to wash their hands (or do so for them if they’re young). Practice cough covering and sneeze covering. And above all, stay home and rest if sick. These tips apply equally to children and adults.

When it comes to car safety, it’s even simpler: if your child is under 5, rear-face her and don’t stop until she’s 5 and has outgrown her seat. Once she has, booster her until she’s at least 10 and has passed the five step test. And if she’s under 18, don’t let her drive without you.

You don’t have to check to make sure your child fits in one of these categories more than a few times a year unless she’s about to move from one category to the next. The hard part is making–and keeping–the three decisions to keep your child in safe configurations when everyone around you is forward-facing at 1 or 2, strapping their kids in seat belts at 7 or 6 or 5, and encouraging them to drive everywhere, all the time, and with as many passengers as possible from the day they’re legally allowed to at 16 (or 15, or 14 in certain states).

Follow best practices. Ignore foolish ones. That’s how you get everyone home at night.

If you find my information on best practices in car and car seat safety helpful, you can buy my books here or do your shopping through this Amazon link. Canadians can shop here for Canadian purchases.  It costs nothing extra to do so, but when you shop through my links, a small portion of your purchase, regardless of what you buy, will go toward the maintenance of The Car Crash Detective.


In Sweden, Motorcycle Helmets are Mandatory. In Most of the US, They’re Not.

In Sweden, everyone needs a helmet. In the United States, most states don’t care if you do or don’t (or live or die).

The other day I wrote about rates of helmet compliance for motorcyclists in the United States. We looked at what those rates were and how they were affected by helmet laws (or the lack thereof). We also compared helmet laws to seat belt laws and compliance rates for front and back seats in the United States, and then took a final look at helmet compliance in the United States vs in other rich (OECD) countries. The long and short of it is that we don’t require helmets in most states, we don’t make seat belt use a primary requirement (one for which you can be stopped and ticketed) in most states, and as a result, we have significantly lower rates of helmet and seat belt use compared to rates in our fellow rich countries. While I didn’t specifically address rates of seat belt compliance in fellow OECD countries, you can rest assured that, as is often the case, the US has much to learn from our wealthy neighbors.

Today we’re going to take a closer look at helmet compliance by referencing one of those wealthy neighbors–the one that’s brought the most knowledge to the world in domains related to child vehicular safety–Sweden. However, we’re not going to look at child safety today, but at how often motorcyclists in Sweden use helmets compared to how often they do in the United States, and what relevant laws are like. From the article’s introduction, the prior article on compliance and regulatory differences between the US and other rich countries, and the general history of this site, you likely have an idea of where these comparisons are headed.

What percentage of Swedish motorcyclists wear helmets?

Once again, we turn to the IRTAD 2019 Road Safety Annual Report. It turns out that the Swedes, as is almost always the case when it comes to road safety, are much better at following best practices than we are.

For motorcyclists, helmet wearing is the most effective passive safety habit. In Sweden, helmets have been compulsory for users of all of powered-two wheelers since 1975. The helmet-wearing rate of riders of powered two-wheelers is high, at 96-99%.

First of all, there’s the repetition of what we learned in the previous article: helmets are the best passive safety technique you can follow as a motorcyclist. However, the Swedes then took the logical step of requiring helmets, given how much of a difference they make between dead and injured motorcyclists. Helmets have been required for all motorcyclists, regardless of age or region, since 1975. Forty-five years later in the United States, we still haven’t gotten to where the Swedes were in the seventies. This isn’t unusual. We’re the same way when it comes to rear-facing.

Because helmets are required for everyone and have been for a generation, Swedes are used to using them. Between 96 and 99% of motorcyclists are estimated to use them. In other words, if 100 motorcyclists and scooter pilots ride past you, all but 3 of them will be wearing helmets. In the United States, around 29 of them with lack helmets, as we have a 71% compliance rate.

What percentage of Swedish drivers and passengers use seat belts?

The scene is no different when it comes to four-wheeled vehicles. Front occupants have been required to use seat belts without exception since 1975 and rear occupants have had to use them since 1988. Again, in the United States, while most states require occupants to use seat belts, only 18 require front and rear occupants to do so while giving police the authority to enforce belt use without viewing additional traffic violations. In other words, in many states in the US, you can’t be pulled over for not using a seat belt in the front seats without breaking an additional law, and the same exclusion applies to the vast majority of states for rear seat belt avoidance. This sounds foolish because it is foolish. But a lot of laws related to public safety are just like these in the US.

Because the Swedes don’t have foolish seat belt laws, they don’t have foolishly low rates of seat belt use. In fact, compliance rates in Sweden are estimated at 99% for front seat occupants and 94% for rear seat occupants. In the United States, the respective rates are at 89.6% and 76.1%. In other words, if 100 vehicles with 2 people in each of them (one in the front, one in the back) drive by you in Sweden, you’ll see, on average, only one front seat occupant and 6 rear occupants without seat belts. In the United States, you’ll see 10 in the front seats and 24 in the back lacking seat belts.

Why are Swedish rates of helmet and seat belt compliance so much higher than US rates?

Compliance rates are higher–much higher–in Sweden for motorcycle helmets and front and rear seat belts because they have much more stringent laws requiring helmets and seat belts. Our laws are lax and as a result, so is our population. You can’t make responsibility optional and decry a population that doesn’t respond. In the triad of best practices, these decisions fall under both driver behaviors (the decision to use or eschew helmets and seat belts) and infrastructure (the presence or absence of laws encouraging safe behaviors). Some people will use helmets and seat belts even if they aren’t required. Many won’t. And we all suffer for it, whether through the loss of loved ones or through needlessly stressed medical and emergency response systems (making it more difficult for other individuals to receive medical help as needed).

Our laws are lacking. Until they catch up, follow best practices–even if you have to learn them from other countries.

If you find my information on best practices in car and car seat safety helpful, you can buy my books here or do your shopping through this Amazon link. Canadians can shop here for Canadian purchases.  It costs nothing extra to do so, but when you shop through my links, a small portion of your purchase, regardless of what you buy, will go toward the maintenance of The Car Crash Detective.