Tag Archives: autosafety

Your Classic Car is a Deathtrap, or Why Newer Cars are Safer

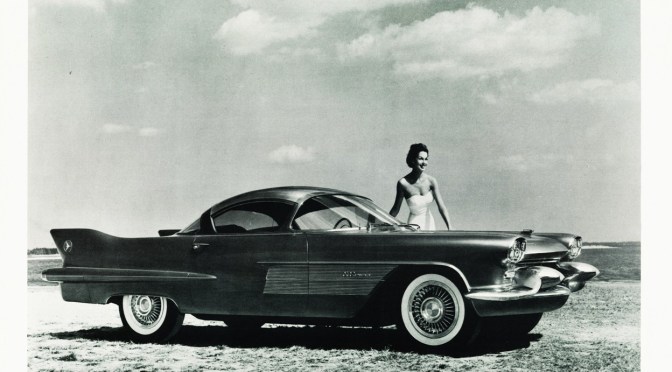
Something I’ve learned over the last several years of looking into crashes is that there are a number of persistent myths floating around the real and online world related to car safety, and one of the most persistent ones is that old cars–and I mean really old, like vintage old cars–were safer than new ones. According to the myth, old cars had steel and things like that, while new cars have airbags and crumple and just aren’t as safe. In fact, some people go as far as to say that the reason new cars have airbags, crumple zones, and plastic parts isĀ because they aren’t as safe.

It sounds good. The problem is that it just isn’t true.

The truth is that new cars are safer than they’ve ever been in the history of the automobile. Classic cars doĀ crumple, and tend to crumple the passenger compartments into the passengers, which is incompatible with life. When they don’tĀ crumple, they tend to transfer much of the force of the collision through the body and into the passenger compartment, where they turn the occupants into shock absorbers with life-ending results.

This video from the IIHS shows a moderate overlap frontal crash test between a 2009 Chevrolet Malibu and a 1959 Chevrolet Bel Air at 40 mph. Both are typical examples of midsized cars from now and way back when, respectively. Notice the lack of seat belt use in the Bel Air? It’s because those weren’t required in the United States until the late 1960s.

Play through the whole crash in slow motion. Note how the Malibu driver simply bounes into the airbag, well restrained, before resuming position. He or she would have survived that collision, and likely done so without significant injury. In comparison, the Bel Air driver would have died multiple times over. Note some of the intangibles, such as how the Bel Air driver contacted the steering wheel (instant brain damage, if not outright death) before bouncing into the roof (more brain damage and a broken neck, if not death).

Old cars are deathtraps. New cars are much safer. Friends don’t let friends drive classic cars.

ā€”

If you find the information on car safety, recommended car seats, and car seat reviews on this car seat blog helpful, you can shop through this Amazon link for any purchases, car seat-related or not. Canadians can shop through this link for Canadian purchases.

What the Mazda 5’s Safety Scores Mean for Your Family

From reading this blog, you’ll know that when it comes to best practices in car safety, I advocate both driving safely and choosing your vehicles thoughtfully (which also extends to choosing a safe vehicle for your teenager, if you have one). Driving is one of the most dangerous things people do on a daily basis, and it makes sense to take it seriously and do everything possible to drive safely. With that said, sometimes the vehicle end of driver safety brings unwelcome surprises, and that was recently the case with the Mazda 5.

The IIHS finally got around to testing the Mazda 5, and the results were less than stellar.

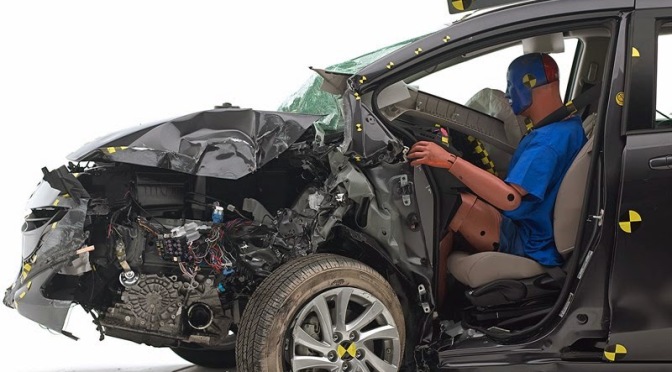
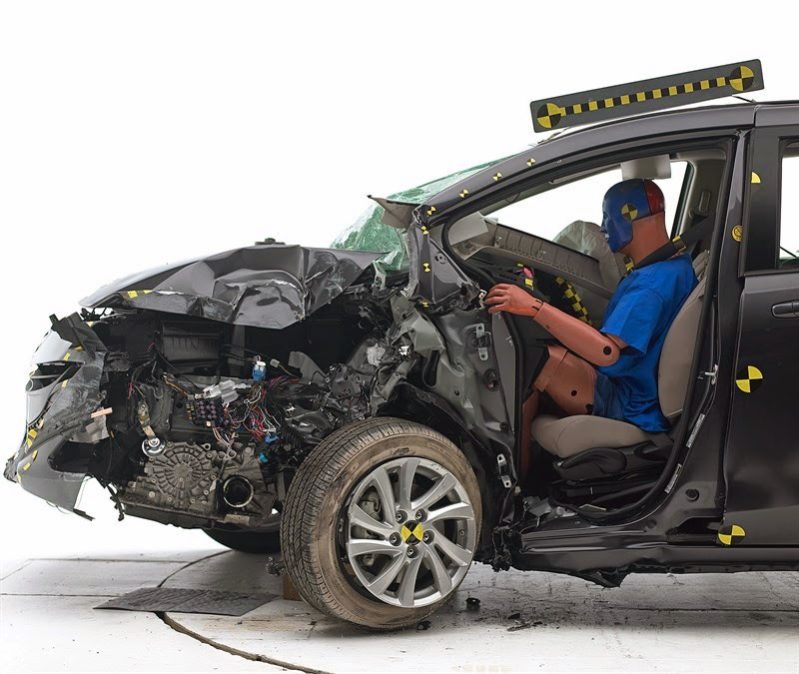
Poor small overlap performance in the Mazda 5

Injury measures taken from the dummy indicate a high risk of injuries to the left thigh and left lower leg in a real-world crash this severe. The steering wheel moved to the right, and the dummy’s head barely contacted the front airbag before sliding off the left side. The safety belt allowed the dummy’s head and torso to move too far forward, so the head made contact with the left side of the dashboard. The side curtain airbag didn’t deploy at all, exposing the head to contacts with side structure and outside objects. Plus, the driver door unlatched during the test, something that shouldn’t happen and puts occupants at risk of being ejected from the vehicle.

In other words, in the small overlap collision, the Mazda 5 performed poorly. The most significant issues I see in the “poor” small overlap score are in the load levels placed on the left femur (11 kN); this points to a high likelihood of a broken thigh-bone, which is an extremely painful and limiting injury. Beyond that, the door opening means it would be easy to be flung out of the vehicle if any issues whatsoever occurred with the seat belt. Being ejected in a collision severely increases your odds of dying, whether by the trauma of contacting the ground, a tree, etc, or by the trauma of being run over by a passing vehicle. Doors shouldn’t open in any collisions.

Poor side impact performance in the Mazda 5


The second issue with the Mazda 5 involved its side impact scores:

The Mazda 5 earns a marginal rating in the side impact test. That also makes it the only 2014-model car the Institute has evaluated to earn anything less than acceptable in the side test. Most models earn a good rating. Measures taken from the driver dummy indicate a likely pelvis fracture, and measures taken from the dummy seated in the rear passenger seat indicate that rib fractures and/or other internal organ injuries would be possible in a crash of this severity.

The wording here makes it sound as if the Mazda 5 was the only new vehicle to score less than well on the side test, which isn’t true; when the IIHS says “car”, they mean “car”, and not “minivan” or “SUV” of any kind, which means that vehicles like the Jeep Wrangler 4-Door, which also scored a “marginal” side impact score, don’t count here, as they classify the Wrangler as a “mid-sized SUV.” That said, the score is still unacceptable.

What does this mean for my family and child’s safety?

It means that the Mazda 5 isn’t as safe of an option for transport as its fellow minivans, such as the Honda Odyssey and Toyota Sienna. But that doesn’t mean that it isn’t a safe vehicle. It has a good moderate overlap front score and a good roof score. It has side airbags and ESC. The small overlap score is poor, yes, but you can generally assume that the score would have been poor for every other vehicle without a small overlap score except for Volvo, which has been testing for the small overlap collision since the 1980s. The side score should be much better, but it’s still better than what you can expect from just about any vehicle that doesn’t have side curtain airbags, and the majority of vehicles did not have those until a few years ago.

In other words, this doesn’t mean you need to sell your Mazda 5. It just means that there are areas in need of significant improvement. To minimize your risks of death or injury in the Mazda 5, follow safe driving practices; they make much, much more of a difference than whether the small overlap and side scores are good or not.

ā€”

If you find the information on car safety, recommended car seats, and car seat reviews on this car seat blog helpful, you can shop through this Amazon link for any purchases, car seat-related or not. Canadians can shop through this link for Canadian purchases.

Why Are Swedish Roads So Safe?

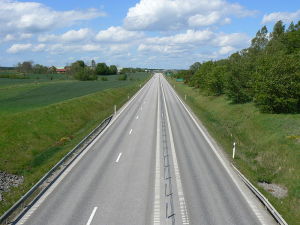
Sweden is essentially the blueprint when it comes to best practices for car seat safety, but there are also a number of things we can learn from the country when it comes to general car safety. This will be the start of a series of posts investigating the safety of Swedish roads and determining what we can learn from them at a national, state, community, and individual level to make our roads safer for everyone.

This article from the Economist provides a brief primer to recent developments in Swedish road safety. A record low was set in 2013, with only 264 people dying in car crashes. The current death rate (for 2013) is approximately 3 per 100,000 Swedes, compared to 11.4 per 100,000 in the US, and 40 per 100,000 in the Dominican Republic, where the roads are the most dangerous on the planet in per capita terms.

To provide another perspective, in 2012 in the US, the most recent year for which full data is available, 33,561 people lost their lives, while the population was 313.9 million, for a rate of 10.7 per 100,000. There are around 9.7 million Swedes. If the US 2012 death rate could have been reduced to Swedish 2013 levels, only 9,417 individuals would have perished, instead of 33,561.

That’s an incredible difference, isn’t it?

The last time the US had an auto death rate as low as 3 per 100,000 was in 1912, the year the Titanic sank. Back then, 2,968 people died, and the US population as 95 million. The last time we lost only 9,000 individuals to car crashes was in 1917, when we lost 9,630, and there were 103 million in the country. By then, though, the death rate was almost was bad as it is now, as it had already soared in just five years to 9.3 per 100,000.

So what has made the difference?

Deaths from car crashes are unacceptable to the Swedish government

Well, a big part of it was the “Vision Zero” project.

In 1997 the Swedish parliament wrote into law a “Vision Zero” plan, promising to eliminate road fatalities and injuries altogether. “We simply do not accept any deaths or injuries on our roads,” says Hans Berg of the national transport agency. Swedes believeā€”and are now provingā€”that they can have mobility and safety at the same time.

Interesting, isn’t it? The goal of completely eliminating fatalities and injuries in collisions, and the perspective that any deaths or injuries were unacceptable. It’s an idea that would be greeted with scorn in the US, as here we accept car crashes and the needless miseries they bring as facts of life, despite the fact that the overwhelming majority of them are preventable.

Planning has played the biggest part in reducing accidents. Roads in Sweden are built with safety prioritised over speed or convenience. Low urban speed-limits, pedestrian zones and barriers that separate cars from bikes and oncoming traffic have helped.Ā 

Planning has been mentioned by a number of sourcesĀ as one of the factors that sets the US apart (in a bad way) from fellow rich countries making much bigger gains in reducing deaths. Look at that–roads built for safety over convenience. That means roads that slow travelers, since speed = death, as you’ve likely seen from so many calculations on this blog. It shouldn’t be convenient to travel at 70 or 80 mph by car; people, by far and large, aren’t capable of managing vehicles with the necessary accuracy at those speeds.

Pedestrian deaths increase disproportionally with speed

Similarly, lower speed limits in urban zones are essential. A car hitting you at 20 mph has somewhere around a 5% chance of killing you. By 30 mph, those odds jump to 50%, and by 40 mph, you’ve got a 95% chance of being dead. It’s not linear; it’s exponential. This is why car crashes become serious so quickly with even just a bit of speeding. Yet speeding runs rampant throughout the US, and we pay for it with blood.

How do we protect cyclists – and how do cyclists protect us?

The same issue arises when discussing traffic separation. Bicycles are not cars; they have no inherent protection, much like pedestrians, and must be separated from vehicular traffic, much like pedestrians. In bike-friendly countries, bicycles have dedicated lanes, like sidewalks, but for bicycles, that go everywhere roads do. As a result, people feel safe to ride, which makes the roads even safer, as drivers learn to look out for cyclists. It’s a virtuous cycle.

Building 1,500 kilometres (900 miles) of “2+1” roadsā€”where each lane of traffic takes turns to use a middle lane for overtakingā€”is reckoned to have saved around 145 lives over the first decade of Vision Zero. And 12,600 safer crossings, including pedestrian bridges and zebra-stripes flanked by flashing lights and protected with speed-bumps, are estimated to have halved the number of pedestrian deaths over the past five years.Ā 

This is an elaboration of previous points. The most vulnerable travelers (pedestrians and cyclists) need to be protected. 2+1 roads, furthermore, in Sweden, are frequently designed with cable barriers, which are a great way of preventing the head on collisions that take so many lives on rural roads in the US (which are where most road fatalities in the US occur). The Swedes realized that it simply didn’t make sense to have human-steered vehicles hurtling toward each other in opposite directions at breakneck speeds with nothing between them but air and a broken yellow line.

Strict policing has also helped: now less than 0.25% of drivers tested are over the alcohol limit. Road deaths of children under seven have plummetedā€”in 2012 only one was killed, compared with 58 in 1970.

Sobriety testing and checkpoints are considered “meddling” by “big government” in the US, but in other countries where citizens place higher weight on the collective good, these checkpoints are much more common, and the separation of alcohol and the automobile is taken far, far more seriously.

And because this is also a car seat blog, here’s another reference to that amazing commitment to child safety. Only one child under 7 died in a car collision in 2012. A direct comparison is hard to find in the US, but in 2012, 480 children 8 and under died while passengers. At the Swedish proportion (1/264), we would have expected around 127 children 8 and under to have died. The fact that nearly 4x as many died is as clear an indicator as any that the Swedes are protecting their children in cars much better than we are. I strongly suspect a default acceptance of ERF plays a significant role in this magnitude of a difference.

Eventually, cars may do away with drivers altogether. This may not be as far off as it sounds: Volvo, a car manufacturer, will run a pilot programme of driverless cars in Gothenburg in 2017, in partnership with theĀ transport ministry. Without erratic drivers, cars may finally become the safest form of transport.

The article ends with a look toward the future and a nod toward driverless cars. While I doubt driverless cars will surpass air travel in safety per mile, I do fully believe they will overwhelmingly surpass human-driven cars in safety, and cannot wait until their presence is as prevalent as the seat belt.
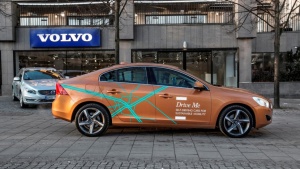
Oh, and the Volvo project has already started.

So what is there to learn from this? Clearly, the Swedes are taking a different approach to auto safety than we are here in the United States. People-centered (rather than auto-centered) planning, lower speed limits, much tighter restrictions on alcohol, and a commitment to eliminating deaths, or an entirely different conceptualization of the inevitability of the auto fatality, are all reaping benefits.

When can we try this here?

ā€”

If you find the information on car safety, recommended car seats, and car seat reviews on this car seat blog helpful, you can shop through this Amazon link for any purchases, car seat-related or not. Canadians can shop through this link for Canadian purchases.
The Financial Realities of Choosing A Safe Used Car for Your Teen Driver

cherokee - 1997 - publicdomain
Affordable cars aren’t necessarily safe ones

If you read this blog, you’ll know that I’m a fan of much of what the IIHS does, particularly with respect to their side impact tests, which I feel are more relevant to real life than the NHTSA’s side impact tests. However, there are a number of policies and practices they espouse that I either directly disagree with or find less than helpful. The institute recently came out with this list of, per their perspective, the best used vehicles for teen drivers. Here are my thoughts on it from a financial angle.

In the survey of parents, the mean purchase price for a teen’s vehicle was about $9,800, while the median was just $5,300. There are many options on the recommended list for under $10,000 but just three that cost less than $5,300.
“Unfortunately, it’s very difficult to get a safe vehicle for a teenager at the prices most people are paying,” says Anne McCartt, IIHS senior vice president for research. “Our advice to parents would be to remember the risks teens take and consider paying a little more.”

This is perhaps the section of the article that bothers me the most. The two lists provided by the IIHS are for vehicles under 20k and vehicles under 10k, yet at least 1/2 of vehicles chosen by parents are under 5.3k. The fact that the average price, 9.8k, is nearly twice that of the median, further indicates that very few parents actually spend 9.8k, but that a few parents are spending large amounts of money (e.g., those buying expensive new cars), which skews the average upward.

Averages can be deceiving when understanding human behavior

It’s sort of like the joke of how if 3 people in a restaurant have 10k each in net worth (e.g., Person A with a net worth of 5k, Person B with a net worth of 10k, and Person C with a net worth of 15k….this would result in both a median and mean, or average, of 10k) and a billionaire walks in, the “average” net worth in the restaurant jumps to 250 million dollars. However, that doesn’t make any of the other 3 people any richer, and the median remains at a far more reflective value of 12.5k (10k + 15k = 25k / 2 = 12.5k), rather than 250 million. A newspaper, television, or other dishonest source of information, however, would tell you that the folks at the restaurant were very well off. But it wouldn’t be true at all.

In other words, averages often have nothing to do with reality. Look for medians to find out what things actually look like on the ground and in the trenches.

With that said, it’s not very helpful to provide a list of expensive vehicles (from the perspective of the parents who actually buy the vehicles) with the knowledge that most parents aren’t going to spend anywhere near the values on the list. To the IIHS’ credit, they do acknowledge that only 3 vehicles on their list cost less than the median value. However, with a list of 95Ā vehicles, at least 47Ā should have been priced less than the median value for the list to be relevant to parents. Instead, 3Ā vehicles fall on the weaker side of the median (the ’06 Sedona, ’05 9-3, and ’06 Passat). That’s just not helpful.

Who are the most dangerous drivers? Not all teenagers are the same

At this point, you might state that the IIHS does encourage parents to spend more on vehicles for their teens. That is absolutely true. However, the problem isn’t that parents aren’t spending enough as much as that new vehicles cost far too much to begin with, which leads to used vehicles costing far more than they should. And statistically, while teenagers may be the most inexperienced drivers on the road (due to having the least amount of time behind the wheel), all teenagers don’t carry equal risks.Ā When rates of involvement in fatal collisions are considered, which, to me, is as good a way as any of analyzing who the dangerous drivers are, the most dangerous drivers on the road in terms of age and gender groups are males between 16 and 29. “The risks teens take” would better be described as the risks malesĀ take, and implying that all teens need big vehicles to protect them from themselves is both patronizing and inaccurate. If anything, young male drivers should drive as little as possible until they turn 30, regardless of which vehicles they’re driving.

The IIHS knows this, as this information is available on their website here. I’ll have another post on that issue later (update: here!). But for now, I’ll end this post with noting that we don’t do parents (or teens) any favors by taking the time to research how much parents actually spend on vehicles for teenagers, and then providing a list of vehicles bearing no relation to the realities of parental budgets, and urging parents to spend more. Not in an economic climate where the cost of a full year of public school education (~25k) for one child is equivalent to half of the median household salary (~50k), and where healthcare eats up ever-larger portions of family finances. It doesn’t make sense.

I’ll also argue against the wisdom of encouraging the vehicular weight arms race by telling parents to buy their teenagers large SUVs and minivans at another time. But for now, my take home message is that promoting $20,000 and $10,000 vehicles for teens when most parents are spending well, well under these amounts does little to actually promote vehicular safety for teenagers.

ā€”

If you find the information on car safety, recommended car seats, and car seat reviews on this car seat blog helpful, you can shop through this Amazon link for any purchases, car seat-related or not. Canadians can shop through this link for Canadian purchases.

Understanding the Physics of Car Crashes

ody03Understanding the physics of car crashes is essential to understanding a number of the things I talk about on this blog, including the forces that impact people and vehicles in collisions. This video from the IIHS is a good primer to some of the physics involved in car crashes.

For example, inertia, or the tendency of bodies in motion to remain in motion, is discussed and related to why wearing seat belts is always a good idea. Momentum, or mass x velocity, is also discussed, with the example of how an 80,000 lb semi traveling at 2 mph has the same momentum as a 4,000 lb SUV traveling at 40 mph. Impulse, or force multiplied by time, is exemplified by throwing an egg against a solid vs. a pliable surface and observing the results.

We are eggs. We need time to survive our collisions. This is why we have crumple zones, seat belts, and airbags. Watch the video and then look at some of the collisions on the blog; you might see them in a different light. This is why we safely restrain our children in car seats that spread out impact forces, as we want moreĀ physics on their side, not less.

ā€”

If you find the information on car safety, recommended car seats, and car seat reviews on this car seat blog helpful, you can shop through this Amazon link for any purchases, car seat-related or not. Canadians can shop through this link for Canadian purchases.