Tag Archives: autosafety

Volvo vs Subaru: Who Makes Safer Cars, Wagons, and SUVs?

As a safety-minded parent and the author of a blog that researches car safety 24/7, whenever I shop for a family vehicle, crashworthiness and crash-prevention is one of my top priorities. I frequently discuss and compare vehicles among a range of metrics, such as which cars, small cars, minivans, and SUVs are most likely to resist a side impact collision, or which minivans are most likely to keep occupants safe during rollovers. Car safety is a big deal to me.

As a result, I often get emails from readers who, as fellow parents, are invested in making the best choices for their families within their budgets. And one of the most frequent questions involves a comparison between Volvo, a brand that has long been associated with safety, and Subaru, a relative up-and-comer that has largely taken the Volvo torch as a company focused on keeping its passengers safe.

To put it simply, readers want to know which of the two brands makes safer, cars, wagons, crossovers, and SUVs. So I got to work to create the most comprehensive answer to this question on the Internet. As always, these are my thoughts, and aren’t gospel from the mountain. That said, I find questions like these fascinating, and pride myself on answering them as thoroughly as possible.

The short answer is that both manufacturers make very safe vehicles. The long answer is a bit more complex, and depends on where you’re looking. This will be part of a series comparing makes and models for safety each year. Here is a previous article comparing the ’15 Odyssey vs the ’15 Sienna.
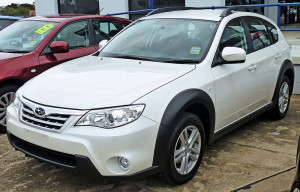
impreza - 2010 - publicdomainThe Small Car and Wagon Market: Subaru!

When it comes to the small car market, Subaru beats Volvo for safety in the United States, simply because Volvo no longer offers a small car in the US. Subaru, on the other hand, offers the Impreza in both sedan and wagon versions, as well as the XV Crosstrek hatchback. All  have good moderate frontal, side, and roof scores, as well as good small overlap scores. The underlying structures of all three vehicles are identical, which means each is about as safe as the other. The ’09-’11 Impreza wagon had a driver death rate of 25 in the most recent IIHS study, which was the best score in its category of small wagons, and the second-best small car score overall. The best went to the ’10-’11 Toyota Prius at 16.

You can see my 3 across car seat guides for the Impreza / Crosstrek here.
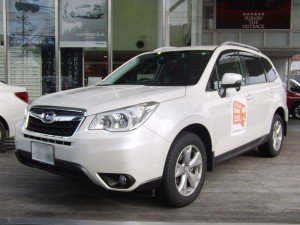
forester - sj - publicdomainThe Small SUV Market: Subaru!

Subaru wins by attrition again in the small SUV market against Volvo, as Volvo does not offer a small SUV or crossover. Subaru, on the other hand, offers the Forester, which, like the Impreza and Crosstrek, features good moderate frontal, side, and roof scores, as well as good small overlap scores. The ’09-’11 Forester had a driver death rate of 20 in the most recent IIHS study, which, while better than the Impreza’s score above, was only in the middle of the pack among small SUVs. The best was the 2WD ’08-’11 Jeep Compass at 7.

You can see my 3 across car seat guides for the Forester here.
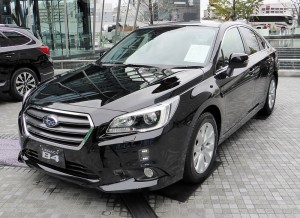
legacy-2015-publicdomainThe Mid-sized Car and Wagon Market: Subaru!

The mid-sized car and wagon market is where Subaru and Volvo finally go head to head, and although it’s a close competition, Subaru wins again! Let’s look at how:

In the sedan arena, Subaru has the Legacy, while Volvo has the S60. The ’10-’11 Legacy was the first non-luxury car to ever be estimated to have a zero driver death rate by the IIHS, which is as strong a testament to its safety as any vehicle can achieve. The S60 did not sell enough models in the same time period to show up in the DDR study, so I have to give the nod to the Legacy there.

The picture becomes still clearer when looking at crash tests. At first glance, both vehicles look excellent here, with good moderate frontal, side, and roof scores, as well as good small overlap scores. It’s worth noting, however, that the Legacy is also one of the most side-impact resistant cars you can buy in 2015, with 19.5 cm of resistance. The S60, on the other hand, doesn’t make the list.

Here is another difference well worth acknowledging. While both vehicles also have “superior” ratings from the IIHS in front crash prevention, if you look at the details, the Legacy, when equipped with the optional EyeSight package, was capable of avoiding a collision when forced to brake at 25 mph. The S60, on the other hand, with the optional Technology package that included collision warning and full auto brake, was only able to reduce its impact speed by 14 mph. In other words, it hit the test vehicle at 11 mph. Subaru clearly wins here.
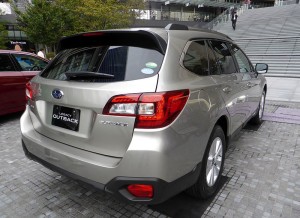
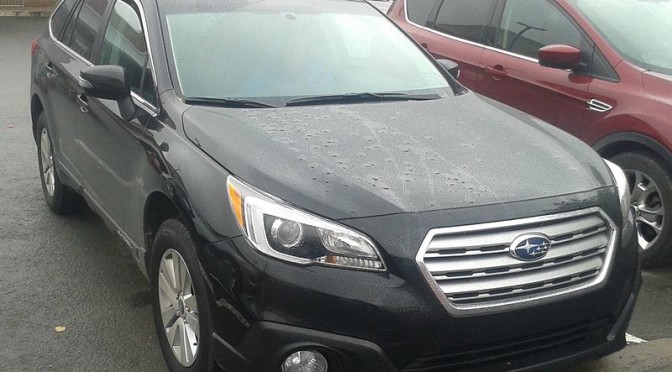
2015 outback - publicdomainThe story is the same when looking at wagons. Subaru offers the Outback, which sells more than every other wagon in the US put together, vs. the V60, the wagon variant of the S60, and the XC70. The XC70 hasn’t been tested by the IIHS, but the Outback and V60 have. The Outback, like the Legacy, features good moderate frontal, side, and roof scores, as well as good small overlap scores and superior front crash prevention scores; the V60 does as well. It’s worth noting, however, that the Outback is also one of the most side-impact resistant cars you can buy in 2015, with 22 cm of resistance. The V60, on the other hand, doesn’t make the list.

However, yet again, when you look at the front crash prevention scores, the Outback pulls ahead of the V60. The Outback, when equipped with the optional EyeSight package, was capable of avoiding a collision when forced to brake at 25 mph. The V60, on the other hand, with the optional Technology package that included collision warning and full auto brake, was only able to reduce its impact speed by 16 mph. In other words, it hit the test vehicle at 9 mph. Subaru wins again.

You can see my 3 across car seat guides here for the Legacy, S60, Outback, and V60.
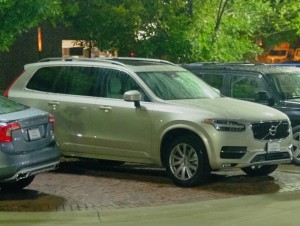
xc90-ccdThe Mid-sized SUV Market: Volvo!

The numbers finally change in Volvo’s favor when we arrive at the mid-sized SUV market, although only due to attrition: Subaru no longer offers a mid-sized SUV. As a result, Volvo wins handily with both the 2-row XC60 and the 3-row XC90. Both crossovers feature good moderate frontal, side, and roof scores, as well as good small overlap scores and superior front crash prevention scores. That said, the XC90 definitely stands out above the XC60 in two ways. The first involves side impact collision resistance. While both vehicles are among the best SUVs you can be in if you’re about to be t-boned, the XC90 is the best vehicle currently available in the United States, with an impact-resistance score of 26 cm. The XC60 comes in at 22 cm–still very impressive, but definitely behind the XC90.

The second area where the XC90 proves itself over the XC60 is in the realm of front crash prevention. With the optional Technology package that included collision warning and full auto brake, the XC90 was capable of avoiding a collision from 25 mph. The XC60, however, wasn’t as capable, and only reduced the impact speed by 13 mph, meaning it hit the test vehicle in front of it at 12 mph. Overall, the XC90 is the better SUV between the two.

You can see my 3 across car seat guides here for the XC90 and XC60.
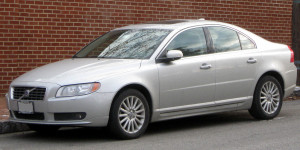
 s80 - 2007 - public domainThe Large Car Market: Volvo!

The large car segment is the last where we can compare Subaru and Volvo, and once again, Volvo wins by attrition, as Subaru doesn’t offer a large car, while the S80 offered by Volvo is a great one. As with every other vehicle on this list, you have access to good moderate frontal, side, and roof scores, as well as good small overlap scores and superior front crash prevention scores.

However, Volvo’s front crash prevention once again doesn’t prove as effective as Subaru’s, as the S80 was only able to reduce the impact speed by 13 mph when traveling at 25 mph, meaning it hit the test vehicle in front of it at 12 mph. It’s better than not slowing down at all, but it’s still a crash.

Do I choose a Subaru or a Volvo to keep my family safe?

This, in the end, is the question you came here to answer. As you can see, the answer depends on where you’re looking. If you want a small car, SUV, or wagon, go with Subaru, as Volvo doesn’t offer any choices and the ones Subaru does are great. If you want a mid-sized SUV or large car, go with Volvo for the same reason–Subaru doesn’t have any available, and the Volvos are great. But if you’re looking for a mid-sized sedan or wagon, I’d go with a Subaru, as the Legacy beats the S60 and the Outback beats the V60. The XC70 is untested, but based on Volvo’s performance with the S80, on which the XC70 is based, I’m pretty sure the Outback would again fare better in the auto brake test and in side intrusion resistance.

In the end, both manufacturers make great vehicles, and safety is just one of many variables to compare between them. But if this is the variable that matters to you, I hope this article has shed more light on what you’ll get out of your next Subaru or Volvo. Stay tuned for more articles comparing the safety of various makes and models.

Please feel free to check out the 3 across car seat guide to see which car seats you’re most likely to be able to fit into your vehicle of choice. I’ll continue adding vehicles every few days until every major car, truck, SUV, or van on the road is there. Finally, do remember to avoid common mistakes parents make with car seats.

If you find the information on car safety, recommended car seats, and car seat reviews on this car seat blog helpful, you can shop through this Amazon link for any purchases, car seat-related or not. Canadians can shop through this link for Canadian purchases.

Rollover Crash Protection: The Safest Family Minivans in 2015

xc1Rollovers are among the deadliest types of crashes we can be involved in as drivers or as passengers, despite being among the rarest types of crashes on the road. The facts from the NHTSA are sobering:

Per FMVSS 216, more than 10,000 deaths a year, or more than 1/3rd of all passenger vehicle fatalities in the US, involve rollover crashes. Of those fatalities, 47 percent of occupants killed are completely ejected from their vehicles, while another 10 percent are partially ejected. It’s worth noting that per the IIHS, only 2 percent of all vehicle crashes involve rollovers, despite their taking 1/3rd of all occupant lives.

While rollovers can last between one and several seconds, a vehicle can complete between 1/4 and 8+ turns (4/4 being a complete 360 degree revolution) in that time span.  These crashes also tend to occur at faster speeds than other crashes since so much energy is required to initiate a rollover. Furthermore, while they can occur in multiple vehicle collisions, by far and large, they’re a single vehicle problem. Three out of every 4 rollover fatalities involve a single vehicle, and more than half of all single vehicle fatalities involve rollovers.

As a result, it’s worth looking into what we can do to reduce our risks of involvement in such crashes. This is part of an ongoing series on the safest vehicles I’m aware of in a range of categories. I recently wrote article on the safest 2015-model year vehicles for side impact crash protection, highlighting the leading cars, small cars, minivans, and SUVs and crossovers.

In the most recent post on small cars, I promised to look into the leading vehicles for surviving rollovers. It took a few months, but I’ve finally been able to define a metric, look at a number of crashes, and crunch some numbers. Let’s take a look at how to survive a rollover, and which factors make this more or less likely in the minivans available today in the United States.

What are the most important safety features a minivan can have for rollover protection and rollover resistance?

There are three features I’d consider essential in any vehicle, but especially in minivans, which are more top-heavy than cars, to adequately protect occupants during a rollover: electronic stability control, rollover-sensing side airbags, and a strong roof structure. Let’s look at each of these three points and then see where the current crop of US minivans stacks.

1. Electronic stability control. Electronic stability control, or ESC, is, in my books, one of the three most important inventions for car safety in the last sixty years, along with the 3-point seat belt and the air bag. Built as an extension of anti-lock brakes (ABS), ESC is designed to reduce the risks of oversteering, understeering, and rollovers by selectively and automatically braking front and rear wheels to maintain the balance and direction of travel of the vehicle.

To put it simply, it cuts your odds of rolling over to begin with by braking in order to keep your vehicle stable. It’s been estimated to cut the risks of a single vehicle fatal crash by 50%. Considering the fact that half of all fatal crashes are single vehicle crashes, this is a big, big deal. The NHTSA has directly stated that they estimate that ESC will reduce the 10,000+ US annual deaths attributed to rollovers to 5,000.

2. Rollover-sensing side airbags with head/torso protection. Most drivers by now understand the need to wear seat belts 100% of the time while driving, but airbags are also an extremely important component of rollover prevention. When your vehicle enters a rollover, you lose complete control of your body. You don’t get to hold on, brace yourself, or do anything else to stop the process. If the vehicle rolls right, your body will try to fly to the left, and directly out the window. If the vehicle rolls left, your body will try to fly to the right and directly out that window. The only way to stop this is to be braced within the vehicle through your seat belt, and that’s not always enough.This is where side airbags with head protection come in.

In some crashes, they make enough of a difference when deploying during rollovers to keep you in the vehicle, or to keep you from fracturing your skull against the window, roof rail, A pillar, or B pillar. They might simply keep your head in the vehicle and away from the ground that would crush it immediately during the rollover. But without such airbags, your odds of survival drop considerably.

Similarly, if you’re in a vehicle that features side airbags but not the kind programmed to deploy during rollovers, it’s like not having them to begin with in a rollover collision, because they won’t deploy unless the rollover is triggered by your being t-boned on the near-side by another vehicle–which makes the crash even more severe.

3. Strong roof. Finally, strong roofs are essential because if your vehicle doesn’t preserve the occupant cabin (which is now your survival space) sufficiently, nothing else matters, as you’re going to be crushed by the weight of your vehicle when it causes your roof to cave in. Or if you aren’t crushed by the caving-in-roof, your seat belt will detach and send you into the roof or out the vehicle. Your airbags will be useless because they either won’t deploy or won’t be there when you need them since the roof rail they deployed from now resembles a pretzel.

To put it simply, without a strong roof, you’re not going to see the end of a rollover, because your life will be over in an instant. But what makes a strong roof?

What makes a strong roof, and what should I be looking for when choosing one?

The strength-to-weight ratio, or SWR, is the most common metric for determining roof strength. There are also dynamic roof tests, but we’ll discuss those another day, as they aren’t nearly as common, although they’re potentially even more useful than the SWR. The NHTSA recently updated their requirement for the strength-to-weight ratio of vehicles in the United States. The SWR essentially describes how many times the weight of a vehicle the roof line must support before caving in up to a certain degree (5 inches).

The longstanding government requirement was only 1.5x the vehicle’s weight, and this only applied to vehicles that weighed less than 6,000 lbs. This wasn’t nearly enough, and both the NHTSA and vehicle manufacturers knew it, but nothing changed for decades until the IIHS started their own roof strength program, in which they required a SWR of 4.0 for a vehicle to be classified as having a “good” roof within their system. Now manufacturers throughout the US regularly strive to reach the 4.0 ratio, though not all do. The NHTSA finally updated their requirement to require an SWR of 3 for <6,000 lb vehicles and a ratio of 1.5 for vehicles between 6,000 and 10,000 lbs. It’s still not nearly enough, but it’s a start.

Given all of these metrics, I made my list of the best minivans to be in when attempting to survive (or better yet, avoid!) a rollover by weighing and combining each. ESC came first; any vehicle without it was automatically dropped to the bottom of the list. Next came side airbags with rollover sensors; vehicles with roll-sensing side airbags were automatically ranked higher than those with regular side airbags, while those without side airbags as standard features were stricken from the list. Finally, vehicles with both ESC and roll-sensing side airbags were sorted by the relative strengths of their roofs compared to their weights (SWR). Vehicles without roll-sensing airbags are ranked after vehicles with them and then sorted by SWR.

The safest minivans for avoiding and surviving rollovers in 2015

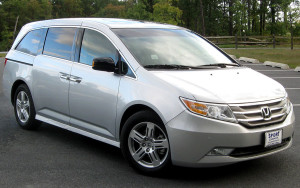
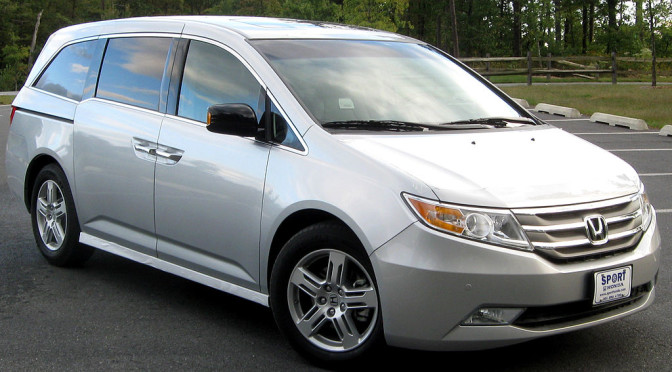
ody - 2011 - publicdomain25.87 – 2014-2015 Honda Odyssey.
5.15 – 2011-2013 Honda Odyssey.

The current generation Odyssey is not only the safest minivan you can buy today for surviving side impacts, it’s also the safest minivan on the road to be in if you’ve got to be in a rollover. It features ESC, rollover-sensing side airbags, and a roof capable of supporting nearly 6x its weight before life-threatening levels of caving in. This is as good as it gets right now. It’s not surprising that the initial version of this generation, the ’11-’13 Odyssey, was only the second minivan ever estimated by the IIHS to have had a zero driver death rate (the first was the ’08 Sienna).

It’s worth comparing the latest Odyssey to previous ones to see how far it has come. The ’11-’13 Odyssey had a 5.15 SWR, which was a huge step forward from the ’05-’10 generation, which Honda estimated was 2.2x weaker, suggesting an SWR of 2.34, even though it was never officially measured by the IIHS or released by Honda. The ’11-’13 Odyssey, however, with its 5.15 SWR, ESC, and roll-sensitive airbags, is the next best option on this list after the ’14-’15 Odyssey.

Returning to the ’05’-10 Odyssey, it’s worth noting that a 2.34 SWR, while “poor” on the IIHS’ scale (the marginal/poor threshold is 2.5, while the acceptable/marginal threshold is 3.25), was still significantly higher than the NHTSA’s archaic 1.5 requirement. The ’05-’10 Odyssey had a driver death rate of 17, with rollovers comprising 3 of the 5 projected single vehicle collisions. This generation of the Odyssey came with roll-sensitive airbags and ESC, as has every generation since.

My full 3 across car seat guide to the various generations of the Odyssey is here.

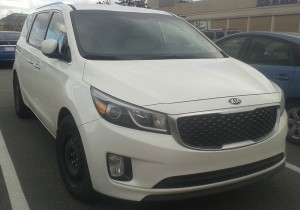
sedona - 2015 - publicdomain4.82 – 2015 Kia Sedona.

The current generation Sedona includes ESC and roll-sensitive airbags, but it trails every Odyssey between ’11 and ’15 due to a 4.82 SWR. However, it still can be expected to show an impressive level of performance in rollover avoidance and survival.

The previous generation Sedona (’06-’14) was a much poorer vehicle in comparison on paper, but still a safe vehicle in practice. While it did have ESC, it did not have roll-sensing side airbags, but regular side airbags, and it also had a 2.31 SWR on the roof, which was about identical to that of the ’05-’10 Odyssey.

However, despite the fact that it didn’t feature roll-sensing airbags, its overall ’08-’11 driver death rate was almost identical to that of its equivalent-generation Odyssey at 16, while its rollover death rate from the 0 estimated single vehicle fatalities was zero (unlike 3 in the ’05-’10 Odyssey). This serves as a potent reminder of the complexities of crash survival, and of how no single metric can provide the answers to every safety-related question.

My full 3 across car seat guide to the various generations of the Sedona is here.

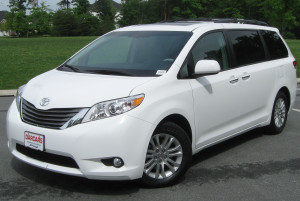
sienna--publicdomain4.12 – 2015 Toyota Sienna

The ’15 model year of the current generation Sienna includes ESC and roll-sensitive airbags, but it trails not only every Odyssey since ’11, it also trails the ’15 Sedona. That said, it’s still a very solid choice for rollover risk mitigation with its 4.12 SWR.

The biggest issue with the Sienna comes with its ancestor. The ’11-’14 model years share the 4.12 SWR and ESC, but, much like the ’06-’14 Sedona, lack roll-sensitive side airbags. As a result, I’d place the ’11-’14 Sienna  behind the ’05-’10 Odyssey, which, despite its lower SWR, did feature roll-sensitive airbags.

The ’11 Sienna also featured a surprisingly high DDR of 27, in which an alarming 15 of the 16 single vehicle deaths were attributable to rollovers. Given the strong roof and presence of ESC, I have to wonder whether the near-complete alignment between rollovers and single vehicle fatalities in that model year were related to the lack of roll-sensitive airbags.

Whatever the reason, I’d also rank the ’11 Sienna behind the ’06-’14 Sedona, which had a DDR of 16 with 0 single vehicle rollover deaths, and behind the ’08 Sienna, which included ESC and side airbags but no roll-sensitive function and no public roof score, yet still achieved a DDR of zero.

My full 3 across car seat guide to the various generations of the Sienna is here.

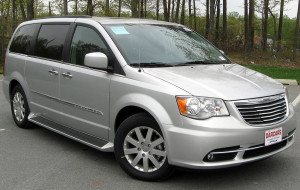
town&country-publicdomain2012-2015 Chrysler Town & Country (not recommended) / Dodge Grand Caravan (not recommended).

I unfortunately can’t recommend either the Town & Country or its Dodge twin, the Grand Caravan, due to the fact that neither vehicle includes roll-sensing airbags as standard features. They aren’t even available as options. Given the fact that ESC and roll-sensing airbags have been standard features with Honda since ’05 and Kia and Toyota since ’15, I can’t recommend minivans that haven’t joined the party. Hopefully Fiat Chrysler Automobiles will make these changes soon; they have roll-sensing airbags on a number of their SUVs already, including the Dodge Durango, Jeep Grand Cherokee, Jeep Cherokee, and Dodge Journey, so they’re well aware of the technology. They simply need to make it standard and available for the safety of the families who trust them with their lives.

For what it’s worth, I do like that the T&C / Grand Caravan have 4.51 SWRs, and have had them since ’12.

My full 3 across car seat guide to the various generations of the Town & Country is here, while the equivalent guide to the Grand Caravan is here.

quest - 2011 - publicdomain2011-2015 Nissan Quest (not recommended).

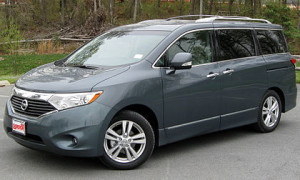
Unfortunately, I can’t recommend the Quest for the same reason I couldn’t recommend either the Town & Country or the Grand Caravan: it lacks roll-sensing side airbags. Even worse than the aforementioned SUVs, it’s the only ’15 model year minivan that doesn’t feature a good roof score; it falls on the low end of the “acceptable” range with an SWR of 3.36. While this is better than the ’05-’10 Odyssey’s SWR, as well as that of the ’06-’14 Sedona and almost certainly the ’08-’11 Sienna’s, it’s 2015, and every new vehicle on the road should be starting with a 4.0 SWR, not aiming to achieve it. Nissan can and needs to do better.

What do I do if my minivan scored poorly or wasn’t here at all?

The safest minivans for both avoiding and surviving rollovers are, and have been for a while, made by Honda, Kia, and Toyota. However, many readers may not have one of the minivans I described positively above. What do you do?

Personally, I’d do whatever possible to buy a recommended minivan if at all possible if this is a priority. At the very least, a minivan with ESC is well worth the money. If possible, buy one with both ESC and side airbags. Better still is one with ESC and roll-sensing airbags. And best of all is one with ESC, roll-sensing airbags, and an SWR of 4 or more. Vehicles that rank well in these areas tend to rank well in other areas (e.g., side impact protection, frontal crash protection), making them much safer vehicles overall.

We can’t control everything. The safest option is still not driving at all, followed by driving as little as possible. But if you’ve got to drive, drive safely, and do your best to choose a safe vehicle. If you’re going to use it with children, definitely check out the plethora of best practice articles I’ve written here on choosing safe car seats, installation tips, seat reviews, and more information to help you make informed decisions.

I loved writing this article, and I hope you enjoyed reading it. I look forward to writing more articles examining various factors in car safety design and how they relate to keeping you and your loved ones safer while on the road. Stay tuned, remember to avoid common mistakes parents make with car seats, and check out some 3 across car seat guides while you’re here.

If you find the information on car safety, recommended car seats, and car seat reviews on this car seat blog helpful, you can shop through this Amazon link for any purchases, car seat-related or not. Canadians can shop through this link for Canadian purchases.
Pedestrian Fatality Rates Increase with Speed, So Don’t!

traffic - david marcu - unsplash - publicdomainThere are certain things just about “everyone” does when driving that makes driving less safe for just about everyone. Speeding is one of those things. It makes near-misses turn into collisions, it turns mild collisions into severe collisions, and it turns severe collisions into fatal ones.

I’ve written about dozens of collisions that could potentially have been survivable, had one or both drivers involved not been speeding. I’ve also written extensively about car technologies that are helping people survive collisions that would have been universally fatal just a decade or two ago on our roads, such as side impact intrusion resistance in cars, SUVs, minivans, and small vehicles. This is a topic that deserves as much attention as we can give it as a society.

How does speeding affect pedestrians?

Today, however, I’m going to focus on how speeding affects a large segment of the population that doesn’t have the liberty of steel safety cages, collapsible steering wheels, seat belts, or frontal or side airbags. I’m talking about pedestrians, and by extension, cyclists, children, the infirm, and the elderly. In other words, everyone who shares the road with motorized traffic without the protection inherent in most motorized vehicles. These are our spouses, children, brothers, sisters, fathers, mothers, best friends, and coworkers. They could very easily be someone you love. And this is what happens to them when you, or someone like you, is speeding and hits them.

vehicle impact speed and pedestrian injury severity - detr

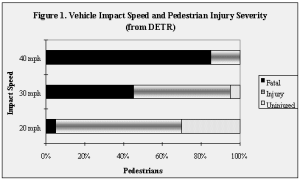
The chart to the left is sourced from a 1999 NHTSA report from the US Department of Transportation titled “Literature Review on Vehicle Travel Speeds and Pedestrian Injuries.” The long and short of it is that the faster motorized vehicles are traveling, the more likely they are to kill or seriously injure the people they run into.

The chart in particular is one of many studies conducted on the gruesome, but particularly important question of just how quickly a car, truck, SUV, or minivan needs to be moving, on average, before it seriously injures or kills a pedestrian unfortunate enough to stray into its path. The numbers vary slightly from one study to the next, but the general idea holds similar across just about all of them, so let’s take a closer look at the chart and answer that question together.

What are my odds of surviving if I’m hit by a car at 20 mph?

The UK DOT analyzed injury and death rates for pedestrians hit by vehicles at 20 mph, 30 mph, and 40 mph. They found that at 20 mph, or at the typical speed limit in school zones in the US, roughly 5% of pedestrians would not survive a vehicular collision. Let’s use a sample of 20 random people (young adults, children, middle-aged men and women, and seniors) to make the percentages more understandable.

In our hypothetical 20 mph collision, a 5% fatality rate means 1 out of 20 individuals would die, whether at the scene or at the hospital. 65%, or 13 out of 20, would survive with some injury, such as a broken leg or arm. A full 30% would walk away without any injuries whatsoever, or 6 out of our sample 20 people. Those are pretty good odds; you’d have a 95% chance of surviving what could otherwise be the last day of your life.

The picture changes dramatically at 30 mph; just 10 mph more.

What are my odds of surviving if I’m hit by a car at 30 mph?


Now we’re at the typical speed limit for urban and suburban areas in many parts of the US. Keep in mind most people in 30 mph zones aren’t going to be traveling at 30 mph; they’re going to be traveling faster. But if they obeyed the speed limit, here’s what would happen, on average, if they hit random members of our random sample of 20 people.

First of all, the death rate jumps to 45%. A full 9 out of 20 people would die, whether at the scene or soon afterward. Game over. No take backs, no do-overs. Just dead. Another 50% would be injured, or 10 out of 20 people. And a scant 5%, or just 1 out of 20 people, could expect to walk away without injury.

The difference is sobering. Think of it the next time you’re driving past a crosswalk, or better yet, crossing one on foot. If you’re hit at 20 mph, you’re going to have a bad day, but you’re almost guaranteed to survive to complain about it the next day. If you’re hit at 30 mph, it’s a coin flip as to whether you’re going to see your loved ones again, ever. Is it fair to give so much power over to someone who wanted to get somewhere, anywhere a few seconds earlier?

Of course, the picture gets still worse at 40 mph. In fact, it makes 30 mph look marvelous.

What are my odds of surviving if I’m hit by a car at 40 mph?


You’re likely to see 40 (or 45) mph speed limits on the outskirts of towns or on 2-4 lane roadways and expressways through large cities (e.g., Lake Shore Drive in Chicago or State Street or Harrison Avenue in Rockford, IL). They’re pretty common, and the odds are good that you can think of an area close to where you live with 40+ mph speed limits that doesn’t require going on the highway. Yet you can also probably think of a number of times when you’ve seen pedestrians attempting to cross such streets, with or without cross-walks. Here’s what would happen, on average, if 20 people were hit at these speeds.

To put it simply, nearly all of them would die at the scene. The death rate jumps to a near-conclusive 95%. That’s 19 out of 20 people, or pretty much everyone. That’s not the injury rate; it’s the death rate. The 20th person would be injured. That’s a 5% survival rate. There are very few diseases with 95% fatality rates (untreated Rabies is the only one most Americans have any real risk of coming across), but those are your odds of dying if you’re hit by a vehicle at speeds you’re likely to find in every city in the country.

Why do the odds of survival change so quickly when hit by a vehicle?

So let’s take a look at the survival odds. At 20 mph, there’s a 95% chance you’re going to survive being hit by a car. At 30 mph, those odds drop to 55%, or literally at about chance. At 40 mph, you have virtually no chance at 5%. The reasons behind these changes are related to kinetic energy, which increases much more quickly than velocity (the equation is KE, or Kinetic Energy, is equal to 1/2 * mass * v^2, or velocity * velocity). In other words, a small change in speed, or velocity, results in a large change in kinetic energy. The increase isn’t linear. Humans think linearly; if you get $100, you can do twice as much as you can if you get $50. But an awful lot of things in life aren’t linear, and the damage done by speeding is one of them.

Doesn’t this mean we should lower all speed limits, and that speeding is only a part of the problem?

It’s absolutely true that speed limits in a number of areas are already far too high. Neighborhood speed limits, for example, should be no higher than 20 mph; children playing in their front yards and crossing the streets with their parents deserve to live as much as those in front of schools during school hours. However, at least there are limits; the least we can do is follow them. Speeding isn’t the whole problem, but it’s the part of the problem we exercise the most control over as daily drivers.

When you exceed speed limits, you’re making a very direct decision to drop someone’s survival odds if they happen to come into your path. Of course, if you’re in a 40 mph zone and traveling at 40 mph, you’re still nearly guaranteed to kill anyone you hit, but at least you aren’t voluntarily increasing risk levels for anyone beyond the inherent designed risks at those sanctioned speeds. That’s not much comfort if you hit someone or if your loved one is hit at those speeds, but at least it’s an acknowledgment that you were following the DOT’s rules.

However, your responsibility increases exponentially if you’re speeding. If you’re doing 40 in a 30 or 30 in a 20, you’re reducing someone’s odds of surviving beyond the odds they already had. This is completely preventable, which makes it completely unacceptable.

The next time you think of speeding, please think of these figures. Even if you somehow avoid being a pedestrian all the time, your loved ones can’t. How far above the speed limit would you want someone to be traveling the next time they approached someone you cared about?

If you find the information on car safety, recommended car seats, and car seat reviews on this car seat blog helpful, you can shop through this Amazon link for any purchases, car seat-related or not. Canadians can shop through this link for Canadian purchases.

The Most Dangerous Drivers in the US:16-29 year-old Men

Road safety is a passion of mine, and is the driving force behind why I created this blog. I’ve written extensively about car seat selection and safe vehicle choices and technologies, but I’ve also extensively advocated for the need to improve our cultural attitudes toward safe and sustainable transportation in order to make our streets and communities safe for everyone (especially those who can’t or won’t drive, such as children, cyclists, the elderly and disabled, and so on).

This entry, as a result, is part of a series about driving in the United States, and the people on our roads who make such driving (and road use) more or less safe. Today’s focus is on the most dangerous drivers in the United States: young men between the ages of 16 and 29. This is a large and influential demographic in our country, and it’s worth looking into how and why they’re dangerous, and what we can do to make them safer, in order to make the roads safer for everyone.

Which drivers are most likely to be involved in fatal vehicle crashes?

iihs - fatal passenger vehicle crash involvements, 2008

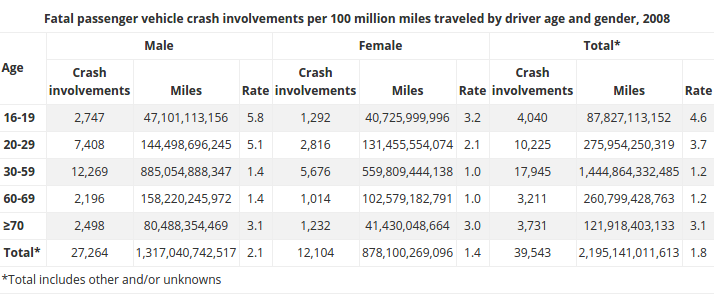
According to an IIHS analysis of USDOT Fatality Analysis Reporting System data, male drivers are universally more likely to be involved in fatal collisions per mile driven than female drivers, as reflected by the 2.1 per 100 million miles traveled rate for male drivers compared to the 1.4 per 100 million miles traveled rate for female drivers. In other words, for every mile driven, a male driver is 50% more likely to be involved in a fatal crash than a female driver. That’s bad enough. But things get even worse when we look at younger drivers.

How dangerous are teenage drivers (male and female)?

Look at the chart closely, and you’ll notice that the two highest rates of fatal crash involvements, and they’re the two highest by a long shot, belong to male drivers. A 16 to 19 year-old male driver is nearly 2x more likely to be involved in a fatal collision than a 16 to 19-year-old female driver. However, a 20 to 29-year-old male is still more than 1.5x more likely to be involved in a fatal collision than a 16 to 19-year-old female driver. The average male driver doesn’t experience a lower rate of fatal crash involvement than the average 16 to 19-year-old female driver until he’s at least 30 years old.

Male drivers between 16 and 29 are the most dangerous drivers on the road. How can we change this?To put it another way, the average male driver is a greater risk on the road, per mile driven, than any other driver, from the moment he gets his license until the day he turns 30. That’s 14 years of being more dangerous than a senior driver of either gender, and that’s 14 years of being more dangerous than a teenage female driver.

This is sobering, but it’s so important to keep in mind. Every day, it’s common to hear talk among people and throughout the news about how dangerous “seniors” are behind the wheel, or how bad “teenagers” are when it comes to taking driving seriously. This paints an incomplete picture of the facts.

While it’s true that there are certainly some poor elderly drivers and that teenage boys and girls are the demographics most likely to be involved in fatal collisions within their genders, a look at the numbers reveals a more accurate picture. And that picture indicates that male teens and young adults are far more likely to be reckless drivers than drivers of any other gender or age group. I’ve written about this before.

How do we make male drivers under 30 safer, more responsible, or at least less dangerous?

That’s a great question, and it’s one with a range of possible answers. For me, one of the most pressing answers involves awareness and education. As I noted above, most people aren’t aware of how often men under 30 are involved in fatal collisions, and many more paint all seniors or teens with too broad of a brush, mistakenly believing they’re the reasons our roads are unsafe.

The truth is, however, that all men are a greater risk at every age than the equivalent female demographic, and that men under 30 are particularly risky drivers. Spreading the word of this truth, from my perspective, is the first step toward creating a culture of safer drivers.

As a male driver, I’ve lived through the two most risky demographics for my gender, and I can easily affirm that my peers didn’t take driving nearly as seriously as it merited, and neither did I more times than I’m proud to admit. But we need to make a change. Too much is at stake on our roads to keep driving the way we do.

Once we start having this discussion, the topic of how to drive safely can then be raised. It’s one the men of this country need to hear.

If you find my information on best practices in car and car seat safety helpful, you can buy my books here or do your shopping through this Amazon linkCanadians can shop here for Canadian purchases.  It costs nothing extra to do so, but when you shop through my links, a small portion of your purchase, regardless of what you buy, will go toward the maintenance of The Car Crash Detective.

Side Impact Crash Protection: The Safest Small Cars in 2015

Lately, I’ve been writing about the safest vehicles we can place our loved ones in when it comes to surviving side impact collisions. First I described the safest cars of 2015 per IIHS side impact intrusion metrics. Next I wrote an article describing the safest minivans available in 2015 for surviving t-bones based on the same metric. I then set to work to write the equivalent article on surviving side impacts in SUVs made in 2015. Today’s article continues the series with an emphasis on side impact collision survival in subcompact and compact (mini and small) cars made in 2015.

As I’ve noted in the previous editions of this series, side impact collisions tend to be the most life-threatening, out of side-, front-, and rear-end collisions. We’re going to dig into the numbers in a minute to explain this.

Unfortunately, due to a number of reasons, car collisions continue to take close to 100 lives each day across the United States. The NHTSA estimates of crash fatalities are always a little lower than the actual number, since the NHTSA only counts traffic deaths that occur on public roads. The NSC does a more accurate job, since they include these deaths. That said, let’s use the NHTSA data from 2013 to look at the impact of side-impact collisions.

What kind of car crash is most likely to be fatal, and what kind is most common, out of front, rear, and side collisions?

Out of the 32,719 auto-related deaths of 2013, 65% of those, or 21,268, involved occupants of passenger vehicles (cars, pickup trucks, and SUVs). Of those collisions, overall, 53% of deaths were due to frontal impacts, 25% were due to side impacts, 5% were due to rear impacts, and around 16% were due to rollovers.

Let’s break that down into multiple-vehicle collisions, since that’s what we’re most interested in here. About 10,950 deaths were in single vehicle crashes while around 10,318 were due to multiple-vehicle crashes. Of that 10,318, 34% were due to side impacts while 56% were due to frontal collisions, 8% were due to rear collisions, and 2% were due to rollovers.

In contrast, when looking at collisions overall, 52% of collision claims made to insurance companies involve frontal collisions, while 21% involve side collisions (10% on the driver’s end and 11% on the passenger’s), and 28% involve rear impacts.

What this means is that even though only around 1 out of every 5 collisions involve side impacts, they lead to 1 out of every 3 vehicle occupant deaths in multiple vehicle collisions. In comparison, basically 1 out of 2 collisions involve frontal impacts, which lead to around 1 out of every 2 multiple collision deaths. Even more dramatically, while more than 1 out of every 4 collisions are rear enders, they only result in around 1 out of every 12 multiple collision deaths.

Looking at the data makes it clear that side impacts are the collisions most likely to be fatal, even though they’re actually the least common type of collision.

Small cars are better for the earth…but which are the safest?

The odds are even more against us when driving smaller cars, since unfortunately, this is a country populated by giant vehicles and people who don’t drive them very safely. This is an example of a side collision between a small vehicle and a large one. The results were tragic, but unfortunately expected, given the speed and mass discrepancies present. But there are plenty of reasons to drive small cars, whether to save money in purchase prices or in fuel, or to lessen our impacts on the environment, or to make it easier to park and drive in general, or to reduce the risks we place on individuals without any vehicular protection, such as cyclists, children, and pedestrians.

With that knowledge in mind, how do we protect our loved ones while driving small cars? Because whether our loved ones are spouses, young children, adolescents, grown children, siblings, parents, or lifelong friends, they deserve to be safe while traveling, even if they aren’t willing or capable of spending the $51,800 necessary to buy the safest car for surviving a side impact, the Mercedes-Benz E-Class. So what other options are there?

How to keep from dying in a side impact collision – what can we do?

Unfortunately, it’s going to take a while before we make the societal changes necessary to make our roads safer for everyone. We have a much more lax policy on drunk driving than most other countries with lower car crash death rates. We have much fewer restrictions on the sizes of vehicles people can drive. We don’t enforce speed limits nearly as much. We also design our roads to make it easy to go quickly instead of safely. We have few transportation alternatives so we have more people who drive farther distances and who drive more frequently.

I’ve written about some of these issues in past articles, such as one on why Swedish roads are among the safest in the world, and another on why driving in Europe is safer than driving in the US. I’ll have more articles soon about the things we can learn from other countries when it comes to driving safely.

However, until we’re willing to make a number of necessary changes, if you’re invested in keeping your family safe from death in t-bone collisions, I’d recommend you:

1.) Avoid driving (e.g., by using public transportation or by cycling or walking…eventually this leads to a critical mass where everyone is safer).

2.) Limit driving (by the same measures above and by combining trips).

3.) Drive the  most side-impact-resistant vehicles possible.

Ultimately, to truly bring an end to side impact collisions, as well as to all collisions, we’re going to need to be forced to invest in the first two measures. I’d consider self-driving or autonomous vehicles to be part of “avoiding driving,” even though those aren’t going to eliminate collisions completely until the vast majority of vehicles on the road are no longer being driven by humans (the critical mass argument).

However, unless you’re in a position to completely follow step 1, you’ll need to focus on 2 and 3. Step 2 isn’t always feasible either, so this post focuses on Step 3, and is specifically related to choosing the safest small cars for side impacts currently available in the US in 2015. The equivalent article about the safest cars of any size for side impacts in the US in 2015 is here while the equivalent article about the safest minivans for side impacts in the US in 2015 is here. I most recently finished the equivalent article on the safest SUVs and crossovers for surviving side impacts in the US in 2015.

Calculating which small cars are the safest for side impact collisions by structural integrity (crush distance)

I’ve written about the math behind these calculations in previous posts, such as in the relevant articles on surviving side impacts in 2015 cars, minivans, and SUVs and crossovers, so hop back to those articles to read about this in detail. The short version is that the IIHS runs a side impact test. It simulates a 3300 lb SUV crashing into the side of a vehicle at 31 mph, or 143.7KJ of kinetic energy. Every vehicle deforms somewhat at the B-pillar when absorbing such an impact, and there’s a subscore in the IIHS test known as the “structure and safety cage” looks into how close the B-pillar intrudes into the center of the driver’s seat during the collision. Less intrusion is better.

The greater that crush space, given a vehicle’s overall “good” score for the side impact test and presence of airbags, the safer the vehicle.The threshold for a “good” subscore in the structural component of the side impact test is 12.5 cm of impact resistance, and for me, that’s where we’re just getting started. It’s possible to have an “acceptable” subscore or even a “marginal” one and still have an overall “good” score, but every component in a vehicle is either adding to or taking away from your safety, and I’m interested in looking behind the curtain, as it were.

Even though a vehicle might score “good” overall on the side impact test, would you rather sit in one with a 3 cm crush space or one with a 30 cm crush space?

That’s what this list is based on. Every cm between you and a life-ending amount of energy is a life-preserving cm of survival space. Let’s see who’s doing the best job at it right now.

I searched through the test scores of every small (compact) or mini (subcompact) car currently available in the US to make this best-of list. Keep in mind that the IIHS continually updates their side impact information while gathering additional information, so in a few months, it’s likely that these numbers may be slightly different. All data is accurate as of Saturday, October 24th, 2015, and all images are courtesy of Wikipedia.

The 10 safest small cars for side impact collisions in 2015

golf - mk7 - publicdomain22 cm – 2015, 2016 Volkswagen Golf / GTI.

I first wrote about the Volkswagen Golf in the overall top car side impact survival list from earlier this summer, and was pleasantly surprised to find a small car being the 3rd best car on the list. In the land of small cars, it’s the best of the bunch. The Golf is available in several flavors, but all feature good safety scores, including the side impact frontal crash test score, and all feature a class-leading 22 cm of side impact intrusion protection.

You can read my full 3 across car seat guide to the Golf / GTI here.

500l - 2014 - publicdomain21 cm – 2014, 2015 Fiat 500L

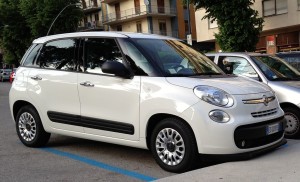
I first wrote about the Fiat 500L in the overall top car side impact survival list from earlier this summer, and was pleasantly surprised to find multiple small cars high on the list. In the land of small cars, it’s the second highest vehicle on the list. It’s the 4-door analogue to the Fiat 500, which is a 2-door subcompact hatchback.The biggest drawback to the 500L is its poor small overlap score, which Fiat needs to address, and soon.

You can read my full 3 across car seat guide to the 500L here.

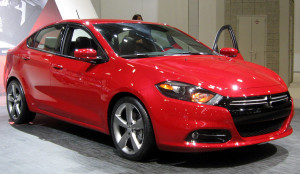
dart - 2013 - publicdomain19 cm – 2013-2015 Dodge Dart.

The Dart was the only other small car to make an appearance on the top intrusion-resistant car list I wrote up earlier, and it’s no surprise as a result to see it rank well here. The Dart features a bevy of good safety scores and also has an acceptable small overlap score. Being a new model (besides the Dart from the ’70s, which was a completely different car), it hasn’t had any driver death rate data published yet, but I’m looking forward to seeing how it does. It’s also worth noting that the Dodge is the second Fiat Chrysler Automobiles vehicle on this list.

You can read my full 3 across car seat guide to the Dart here.

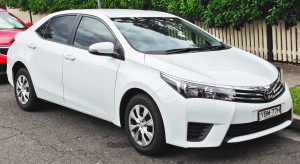
corolla - 2014 - publicdomain18.5 cm – 2014-2015 Toyota Corolla.

The Corolla is the most popular small car in the US, as well as the best-selling small car on the planet. It’s good to see it’s also one of the safest you can buy in the US when it comes to surviving side impact collisions. The biggest safety drawback to the current generation Corolla is its marginal small overlap score. The largest drawback from a car seat perspective is that the current generation is also essentially a 4-person vehicle, and you can’t install 3 car seats across the back row.

The previous generation of the Corolla had a driver death rate of 32 during the ’10-’11 model years,with slightly more than half (18) due to multiple-vehicle crashes. That generation featured 14.5 cm of intrusion resistance. This was one of the best-performing small cars in terms of driver survival in that study, and I look forward to further improvements in the future from Toyota here.

I’ve written up a full 3 across car seat guide to several generations of the Corolla here.

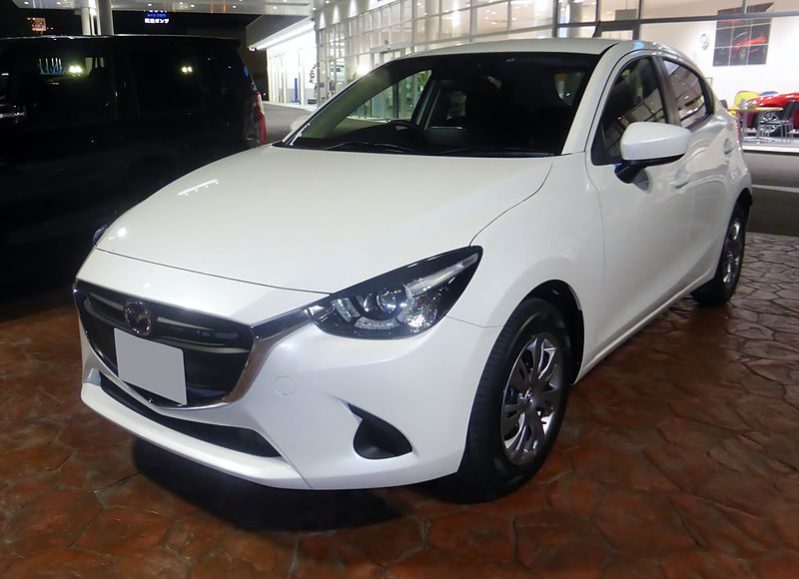
2016-demio-ia-pd18.5 cm – 2016 Scion iA.

Marketed by Toyota’s young-aimed brand Scion, the iA is actually a rebranded Mazda 2, since Mazda and Toyota partnered and Mazda pulled the 2 from the US market as a result. we get to enjoy the iA. The first minicar on the list, it features good safety scores in every area, including in the small overlap test, and even features some level of automated front crash prevention. I’m looking forward to learning more about how the iA performs in real-world conditions under the ultimate metric: the driver death rate.

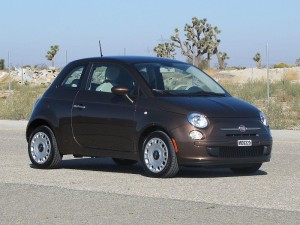
fiat 500 - 2012 - publicdomain17.5 cm – 2012-2015 Fiat 500.

The Fiat 500 is the second minicar on the list, as well as the second Fiat and third vehicle by Fiat Chrysler Automobiles. It has good safety scores in every area except for in the small overlap crash test, where it scored poorly. In that respect, it’s identical to its larger 500 sibling.

Unlike the Fiat 500L, the 500 is a 2-door hatchback and one of the shortest cars on the market, but amazingly, you can still fit multiple car seats in the back seat. And judging by its side impact scores, the children inside will be well protected. Good work, Fiat!

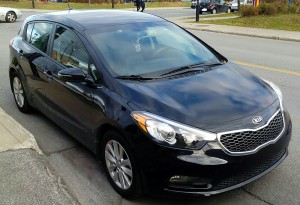
forte - 2014 - publicdomain17 cm – 2015 Kia Forte.

Kia makes their first appearance on any of the best intrusion resistant lists I’ve written so far with the Forte. Like most of the vehicles on this list, it features good safety scores in every area but the small impact test, where it obtained a marginal score. Kia will need to pay attention to that in the future to stay competitive.

The previous generation of the Forte had a driver death rate of 46 during the ’10-’11 model years and a side impact intrusion resistance of 7.5-9 cm, which gives you an idea of how much of an improvement the current generation is over the previous one. I look forward to seeing improvements in that driver death rate as well.

You can see my 3 across car seat guide to the Forte here.

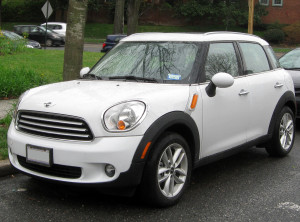
countryman - 2012 - publicdomain16.5 cm – 2011-2015 Mini Cooper Countryman.
The BMW-owned Mini Cooper Countryman also scores impressively in intrusion resistance, and is the first vehicle on the list to feature good safety scores in all IIHS tests, including in the small overlap crash test. It’s Mini’s analogue to the Fiat 500L, being a compact 4-door version of the subcompact 2-door hatchback.

Its smaller sibling, the Cooper, does not yet have a side impact test score available, but I imagine it should do about as well as the Cooper Countryman. The smaller Cooper had a driver death rate of 21 during the ’09-’11 model years and offered 12 cm of intrusion resistance.

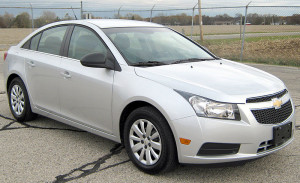
cruze - 2011 - publicdomain15.5 cm – 2011-2015 Chevrolet Cruze.

The Cruze is one of the most affordable cars on this list, and is another example of how safe car designs don’t have to cost a fortune. The largest strike against it is its marginal small overlap crash score, which Chevrolet will need to address in the future.

The first year of this generation, the ’11 Cruze, had a driver death rate of 42, of which nearly all deaths (35) were estimated to occur due to multiple-vehicle collisions. That’s higher than I’d like to see in any vehicle, but I’m hopeful it’ll decrease in coming years as the Cruze (and every other vehicle here) is outfitted with increasingly sophisticated crash prevention technology.

My full 3 across car seat guide for the Cruze is available here.

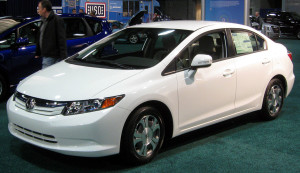
civic - 2012 - publicdomain14.5 cm – 2013-2015 Honda Civic.

Last but not least (well, least in this list, but not compared to all small cars on the market), the Honda Civic deserves mention for its 14.5 cm of intrusion resistance. The previous generation of the Civic featured a driver death rate of 49 (with 28 due to multi-vehicle crashes) during the ’08-’11 model years, which was the worst driver death rate of the vehicles on this list with that data available. However, it’s important to note that it was still statistically within the confidence interval of the driver death rates of the Corolla, Cruze, and Forte. Its intrusion score was 10.5 cm.

I’ve put together a 3 across car seat guide for the Civic that spans several generations; you can access it here.

More broadly, I have to give Fiat Chrysler Automobiles credit for making three of the most intrusion-resistant small cars available in the US market today in the Fiat 500L, 500, and Dodge Dart. They dominate this list the way Ford and Mercedes-Benz dominated the SUV/crossover list and Subaru, Fiat Chrysler Automobiles, and Mercedes-Benz dominated the overall car list. If you’re looking for safe vehicles, these are the manufacturers to pay attention to right now.

How to choose a small car to keep your loved ones safe in side impact crashes

In conclusion, the market for safe small cars keeps getting better every day in the United States. There are several small cars that came within a fraction of a centimeter of making the list, but which I did not include in order to keep the list at the best of the best. The 2014-2015 Mazda 3, 2012-2015 Smart Fortwo, and 2014-2015 Ford Fiesta all tied at 14 cm of intrusion resistance, just behind the Civic.

As in the other lists, the takeaway message is that it’s worth the effort to look past the top “good” score and look at the subscore for structural integrity when looking for safe vehicles to survive side impacts. Naturally, you’ll start out with the overall “good” score and making sure that side airbags are present, but if you’re deciding between vehicles, this is a subscore that should be on your priority list if side impact survival is important to you.

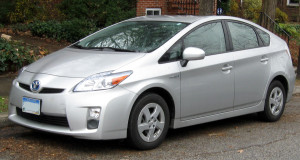
prius - 2010 - publicdomainSmall cars can be as safe as (or even safer than) much larger ones

A final takeaway is the reminder that simply because a vehicle doesn’t show up on this list doesn’t mean that it isn’t safe. When it comes to small cars, the safest one in the most recent driver death rate study (which I’ve discussed extensively here) was the ’10-’11 Toyota Prius with a DDR of 16 and an intrusion score of 11-11.5 cm. That’s nowhere close to the top vehicles here, but its driver death rate was lower than that of most vehicles on the entire list, including much larger vehicles like the Chrysler Town & Country (25), Dodge Grand Caravan (27), Toyota Sienna (27), Chevrolet Impala (35), and Ford F-150 (19-39). That’s very impressive, and a strong reminder that safety doesn’t simply mean driving the largest vehicles you can find.

We can’t control everything. The safest option is still not driving at all, followed by driving as little as possible. But if you’ve got to drive, drive safely, and do your best to choose a safe vehicle. If you’re going to use it with children, definitely check out the plethora of best practice articles I’ve written here on choosing safe car seats, installation tips, seat reviews, and more information to help you make informed decisions.

I loved writing this article, and I hope you enjoyed reading it. I look forward to writing more articles examining various factors in car safety design and how they relate to keeping you and your loved ones safer while on the road. Stay tuned, remember to avoid common mistakes parents make with car seats, and check out some 3 across car seat guides while you’re here.

If you find the information on car safety, recommended car seats, and car seat reviews on this car seat blog helpful, you can shop through this Amazon link for any purchases, car seat-related or not. Canadians can shop through this link for Canadian purchases.