Every few years, the IIHS lets loose calculations on which new vehicles were recently safest and not-so-safe in terms of driver death rates. I enjoy taking a look at the data and fishing out trends. It’s important to remember that a.) there are huge margins of error and b.) vehicle selection is only one third of what’s important in auto safety–the other two being road design and driver behavior. This is part of a series on the IIHS’ summer 2017 Status Report (volume 52, number 3); previous articles include the safest hybrid / electric cars are currently the Volt and Leaf and a Civic is as safe as an Accord. It’s also part of an ongoing series on small car safety; previous articles include how small cars can be safer than the largest SUVs and why we should all drive small cars. Today we’ll look at how the Chevrolet Cruze fared in driver safety compared to the behemoth model-mate Chevrolet Suburban.
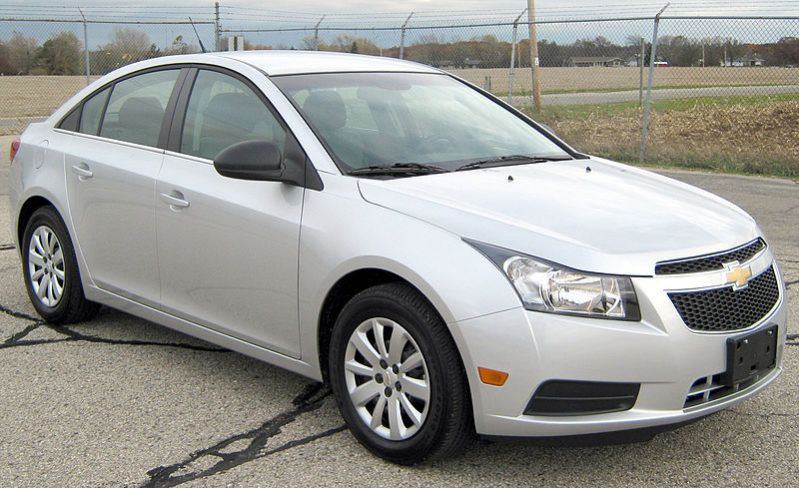
2011-2014 Chevrolet Cruze – 42 driver deaths (32-52)
 According to the IIHS, the Chevrolet Cruze’s estimated driver death rate during the 2011-2014 model years was 42, with 29 of those estimated deaths predicted to occur through multiple vehicle collisions, 13 from single vehicle crashes, and 4 of those 13 from rollovers. The exposure was due to 2,220,302 registered vehicle years. What this means is that the IIHS looked at NHTSA data of auto deaths and their data of registered vehicles and made up a model of how many deaths we could expect to see if everyone drove an ’11-’14 Cruze. Their math suggests that if something like 1 million drivers drove 1 million ’11-’14 Chevrolet Cruzes around the US for a full year, we’d expect 42 of them to die. This was almost identical to the figures for both the Civic and the Accord, by the way.
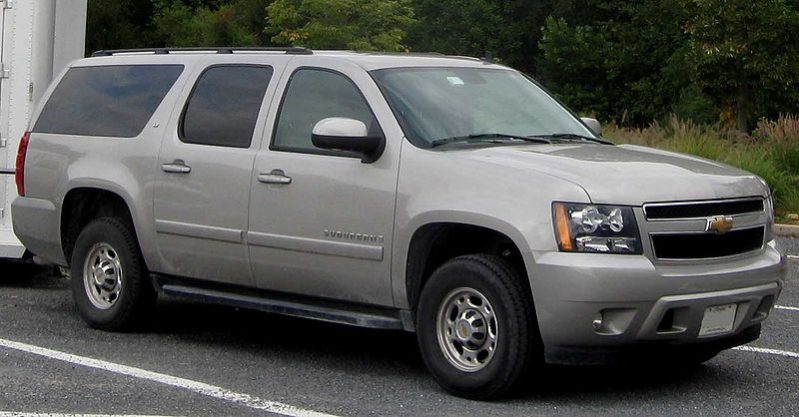
2011-2014 Chevrolet Suburban 1500 4WD – 39 driver deaths (11-67)
 In a statistical dead heat with the Cruze, the 2011-2014 model years of the 4WD Chevy Suburban logged a driver death rate of 39. Of these 39 estimated deaths, 23 were predicted to occur from multiple-vehicle collisions, 16 from single vehicle crashes, and 10 of those 16 from rollovers. The confidence bound spanned 11-67 with an exposure of 293,380 registered vehicle years, a figure close to 1/10th the size of the Cruze’s, which resulted in a much larger confidence bound (spanning 56 instead of 20 with the Cruze). As with the Cruze, it’s important to remember that the DDR doesn’t mean that 39 drivers died driving these Suburbans. It means that if 1 million drivers drove 1 million ’11-’14 Suburbans for a full year, 39 would be predicted to die in the course of the year. It’s also important to note that the 2WD version of the Suburban had a much lower driver death rate of 7 (0-38) with 147,811 registered vehicle years of exposure.
How can the Cruze be as safe as the Suburban if it had a higher driver death rate?
Remember the margins of error I discussed at the start of the article? This is where they become relevant. Looking at the numbers, it would seem that the 4WD Suburban was slightly safer to drive than the Cruze in the aforementioned model years due to a DDR of 39 vs a DDR of 42. However, the single number isn’t what makes the difference; the confidence bounds provide the context, and context is important.
The 95% confidence bounds give an idea of where the true driver death rate would occur in 95% of samplings (e.g., situations where 1 million drivers drove 1 million of the given vehicles for a year). The Cruze’s bounds (32-52) and the 4WD Suburban’s (11-67) overlapped a lot. Specifically, the Suburban’s confidence bound encompassed the entire range for the Cruze. There’s no way, statistically-speaking, to say that either vehicle was actually safer than the other based on the IIHS’ calculations. To put it another way, we can’t statistically state that any DDR difference wasn’t due to chance.
What about the 2WD Suburban? Wouldn’t that be safer than the Cruze?
It’s possible, but it’s still impossible to say given the confidence bounds. Because the confidence bounds of the 2WD Suburban (0-38) still partially overlap with those of the Cruze (32-52), we can’t state that there was a statistically significant difference between the driver death rates of both vehicles. Once again, it’s possible that the difference in DDRs could have occurred purely due to chance. The overlap was much smaller (32-38, or 7 out of 52), suggesting only a 13% chance that they shared the same true DDR. But as long as that chance exists–as long as there’s any overlap–the two vehicles were not statistically different in driver safety. To this end, it’s worth keeping in mind that in the last DDR Status Report (Volume 50, No. 1 in January 29, 2015), the 2011 Cruze had a lower DDR at 42 than the 2WD 2008-2011 Suburban at 60. This is a quick example of how wildly the statistics can swing from one survey to the next with essentially the same vehicles, and why it’s so important not to take the single DDR number as gospel.
How about the 2WD Suburban vs the 4WD Suburban?
As with the 2WD Suburban vs the Cruze, it’s possible the difference in DDRs between the 2WD and 4WD Suburban could be completely due to chance. This also applies to the differences between the 2WD Suburban (0-38) and the 4WD Suburban (11-67). It doesn’t mean the 2WD was actually a safer vehicle than the 4WD. In fact, it’s rather common to see 4WD and 2WD vehicles of the same make and model trade places from one DDR Status Report to the next. In fact, in the last DDR Status Report (Volume 50, No. 1 in January 29, 2015), the 2008-2011 4WD Suburban had a DDR of 17 (0-34) while the 2WD had a DDR of 60 (13-107). The results were completely reversed, even though one of the model years (2011) was the same from one study to the next and the Suburban didn’t see any major design changes in the full span of those years (2008-2014). Most importantly, the confidence bounds overlapped handily and there was still no statistically significant difference between the two vehicles.
Does this mean my son, daughter, husband, wife, children, and family are as safe in a Cruze as in a Suburban?
Statistically speaking, yes. Although the Suburban (2WD or 4WD) is a much larger and expensive vehicle than the Cruze, the actual driving safety as measured by the records of who lived and died driving them didn’t reveal a significant difference in survivability probabilities between the two vehicles. It’s important to remember that the IIHS only looked at driver data, and not survival data for passengers (including children). However, since both vehicles are equipped with the same essential safety features (i.e., good frontal and side crash scores, side airbags with head protection, and ESC), they would likely protect their passengers the same way they did their drivers. A Cruze is a safe family car. A Suburban is a safe, if difficult to drive and fuel-inefficient, family SUV. Vehicles in the US are safe enough; the deaths primarily occur due to how and where we’re driving them.
What can I do to keep my loved ones safe in either (or any) vehicle?
Regardless of what you’re driving, it’s important to remember that vehicle safety only makes up one of the three components tied to auto safety. What make a far greater difference are how you drive and where you drive. Fortunately, driving safely and choosing safe infrastructure doesn’t take money; they just take good judgment. Choose safe speeds, follow best practices with car seats, and choose safe roads, and your family’s odds of being in a crash (or not surviving one) will be much lower than those you’d find from choosing any vehicle, no matter how much it cost.
—
If you find the information on car safety, recommended car seats, and car seat reviews on this car seat blog helpful, you can shop through this Amazon link for any purchases, car seat-related or not. Canadians can shop through this link for Canadian purchases.

