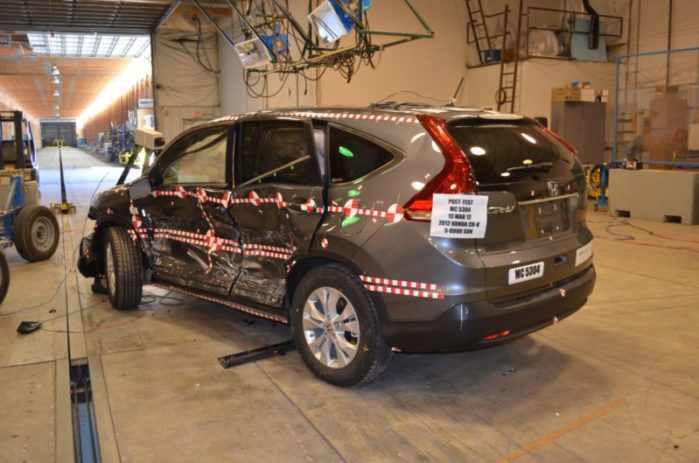
Small SUV Safety: A Honda CR-V is as Safe as a Honda Pilot, Per IIHS Driver Death Rates

Per the IIHS' 2017 driver death rate math, a Honda CR-V is just as safe as a Honda Pilot when it comes to staying alive.
Per the IIHS’ 2017 driver death rate math, a Honda CR-V is just as safe as a Honda Pilot when it comes to staying alive.

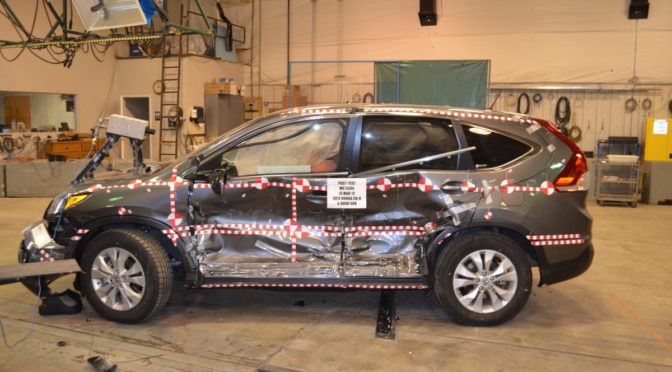
The Honda CR-V and its larger sibling, the Pilot, are two of the most popular small and mid-sized SUVs sold (and manufactured) in the United States. I frequently recommend the CR-V as a safe and responsible choice for teenage drivers and the Pilot is one of the more common vehicles parents email me about when querying 3 across combinations. Many people take it for granted that the Pilot, being significantly larger and heavier, is the safer of the two vehicles for a family–but I’ve long held that driver and road factors are far more important than vehicle factors once a basic level of safety is reached, and the IIHS’ most recent collection of driver death rate data again supports this perspective, showing that the CR-V and Pilot are equally safe vehicles in the all important task of keeping their drivers alive.

The IIHS has once again released their calculations on driver death rates for recently sold (2011-2014) vehicles in the US. The calculations use large confidence intervals and overlook two of the three most important factors in auto safetyhow we drive and where we drive–but they’re still interesting to review. This is the latest in an ongoing series teasing apart the IIHS’ 2017 Status Report (volume 52, number 3); recent articles include Volt vs Prius vs Leaf Safety Showdown, The Civic vs the Accord, A Suburban isn’t safer than a Cruze, Outback, Legacy, or Forester? It doesn’t matter, and A Camry is as safe as an Accord (and vice-versa). Today we’ll revisit Honda and tease apart whether there’s any safety advantage to putting your family in a recent Pilot over a recent CR-V.

2012-2014 Honda CR-V 4WD – 14 driver deaths (6-22)
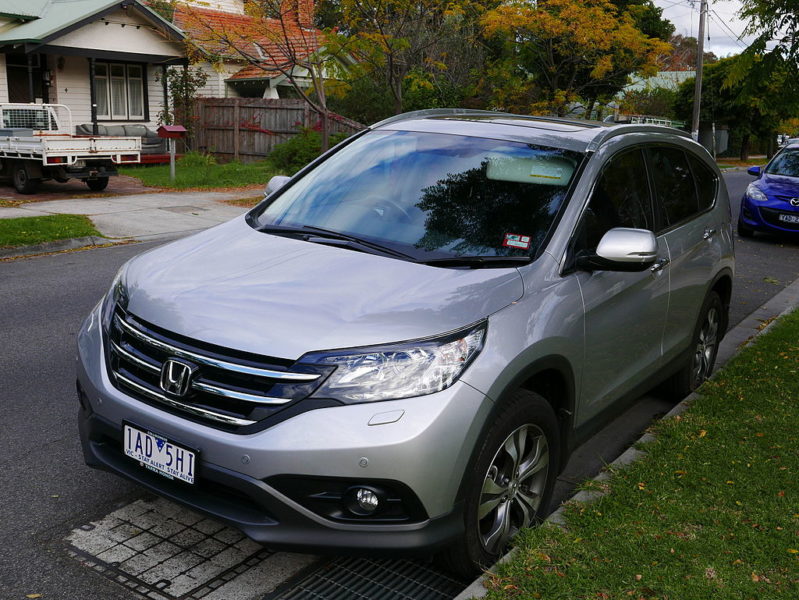
Per the IIHS, the 4WD trim of the 2012-2014 Honda CR-V had a driver death rate of 14, with 10 predicted fatalities occurring from multiple vehicle crashes and 4 from single vehicle crashes. These predictions were based on an exposure of 1,047,803 registered vehicle years and a 95% confidence bound of 6-22.

This doesn’t mean that 14 drivers died driving 4WD CR-Vs of the aforementioned model years during the surveyed years. Instead, it means that the IIHS examined NHTSA figures on who died while driving the aforementioned CR-Vs between 2012 and 2015 and added IHS data on registered CR-Vs during those years before putting all the numbers together in a statistical program. Their analysis suggests that if, for example, 1 million drivers drove 1 million of the aforementioned CR-Vs for a full year throughout the US, 14 would be predicted to die.

The 2WD trim had a close(and statistically identical) driver death rate of 22 with a slightly larger confidence bound of 8-36 due to the smaller (though still relatively large) exposure of 563,737 registered vehicle years. We can’t say the 4WD was safer than the 2WD despite one having a lower driver death rate figure than the other because the confidence bounds of both vehicles overlap. We’ll go into this in detail below when comparing the CR-V to the Pilot. For now, just remember that statistically, both the 4WD and 2WD CR-V had indistinguishable driver death rates.

2011-2014 Honda Pilot 4WD – 15 driver deaths (5-25)
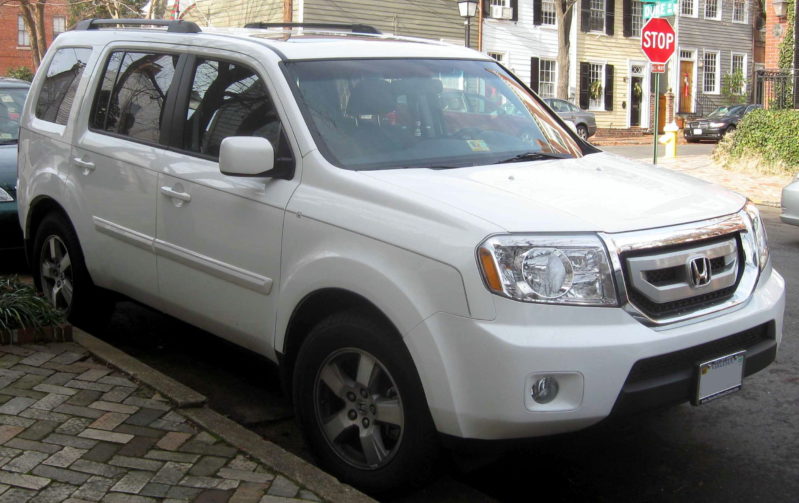
Statistically tied with the 4WD CR-V, the 4WD 2011-2014 Honda Pilot had a driver death rate of 15, with 8 predicted multiple vehicle fatalities and 8 predicted single vehicle fatalities, with 2 of those occurring from rollovers. As in other driver death rate figures (e.g., those of the Camry and Accord), adding multiple- and single-vehicle fatality estimates doesn’t result in the combined driver death rate figure; this is due to statistical rounding. And as with the CR-V, the general meaning of the driver death rate is that, according to the IIHS’ math, if 500,000 drivers drove 500,000 Pilots for 2 full years around the US with typical mileage and driving patterns, we would expect 15 of them to die. The exposure was based on 893,584 registered vehicle years.

The 2WD trim had a nearly identical (and again, statistically identical) driver death rate of 17 with a slightly larger confidence bound of 3-32 once again due to the smaller exposure of 462,277 registered vehicle years. As with the CR-V, we can’t say the 4WD was safer than the 2WD despite the already-minuscule difference in driver death rates because the confidence bounds of both vehicles once again overlap.

Now that we’ve laid out the figures, let’s go into why they don’t matter from a statistical point of view!

How can both vehicles be equally safe if the Pilot is so much bigger than the CR-V?
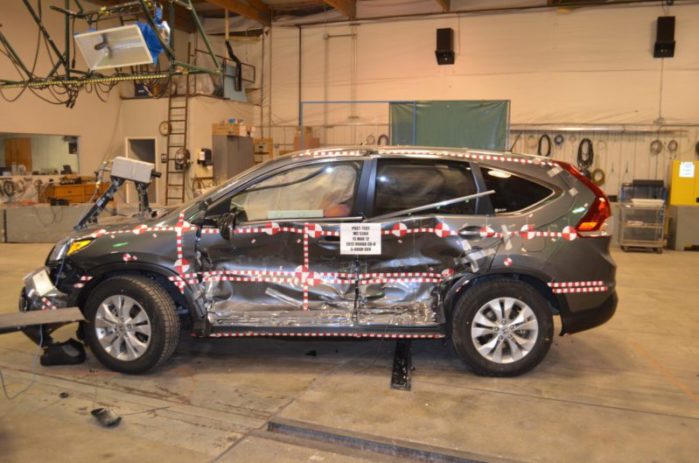
A CR-V is as likely to get your family home as a Pilot (and with much better mpg).

This is where the math gets fun. Although the Pilot is much larger than the CR-V, statistically, the IIHS’ math did not find a difference in the rate at which they kept their drivers alive, which means that, practically speaking, both vehicles are equally safe.

We know there wasn’t a difference between both vehicles (indeed, between all four trims) because their confidence bounds overlapped. The 95% confidence bounds tell us where the true driver death rate would be located 95% of the time we looked for it by sampling the cars and drivers (e.g., sampling 1 million drivers driving 1 million CR-Vs for a year or 2 million drivers driving 2 million Pilots for 6 months or 250,000 drivers driving 250,000 CR-Vs for 4 years, etc).

Per the model, the 4WD CR-V’s true driver death rate would almost always fall between 6 and 22 (between 8 and 36 for the 2WD), while that of the 4WD Pilot would almost always land between 5 and 25 (3 and 32 for the 2WD). There’s a chance (6-22, or 17, out of 5-25, or 21, or 81%) that both 4WDs shared the same true driver death rate. Even expanding to compare all four vehicles, the overlap was 8-22, or 13, out of 3-32, or 30, or 43%, that all four trims of both vehicles shared exactly the same true driver death rate. It’s possible the CR-V had the lowest true driver death rate. It’s just as possible that this title belonged to the Pilot. We don’t know, though, and there’s no way to statistically prove which vehicle was safer (or safest, including the 2WD trims). As a result, all four trims were effectively the same, safety-wise.

I’ve written extensively before about how some of the smallest cars on the road can have lower or equal death rates to some of the largest (e.g., the Chevy Cruze vs the Suburban), or the Prius vs (a lot of really large cars, minivans, SUVs, and pickup trucks). Once you have basic safety features in place, the lion’s share of whether you make it back to your family has almost nothing to do with what you’re driving, but with how and where you’re driving.

What about the 2WD CR-V vs the 2WD Pilot?

As shown above, they were also statistically indistinguishable. As was the 2WD CR-V vs the 4WD Pilot, or the 4WD CR-V vs the 2WD Pilot. Despite the persistent myth of the additional safety of 4WD vs 2WD, when it comes to driving safety in terms of your risk of death while driving, there isn’t actually a statistically-significant difference between most vehicles. The only real advantage of 4WD is that it helps you get going in areas where you might get stuck with 2WD (heavy snow, slush, or mud). It does nothing for steering or braking–every modern car has two wheel steering and four wheel braking by default.

Does this mean my loved ones–husband, wife, kids, or family–are just as safe in a CR-V as they would be in a Pilot?

Per the IIHS’ math, yes. All four vehicles included the same core safety features (i.e., good frontal and side crash scores, side airbags with head protection, and ESC), and it’s likely these benefits would extend to passengers as well as to drivers. All four vehicles are good, safe family choices. If you or your loved ones are lucky enough to drive any of them, whether you make it home or not each day will have far more to do with how and where you drive than on which vehicle you’re sitting inside–which, statistically speaking, is irrelevant.

What’s most important to know to keep my family safe in a CR-V, Pilot, or any other SUV or CUV?

What’s most important to take away from this article doesn’t have anything to do with either of the vehicles I just profiled. Rather, it has to do with the degree to which you follow the following three rules. To keep your loved ones safe, choose safe speeds, follow best practices with car seats,  and choose safe roads. Following these principles will increase your family’s chances of both avoiding and surviving car crashes to a greater extent than any benefits you’d get from choosing any car you can currently buy or that the IIHS or NHTSA can recommend.

If you find my information on best practices in car and car seat safety helpful, you can buy my books here or do your shopping through this Amazon linkCanadians can shop here for Canadian purchases.  It costs nothing extra to do so, but when you shop through my links, a small portion of your purchase, regardless of what you buy, will go toward the maintenance of The Car Crash Detective.

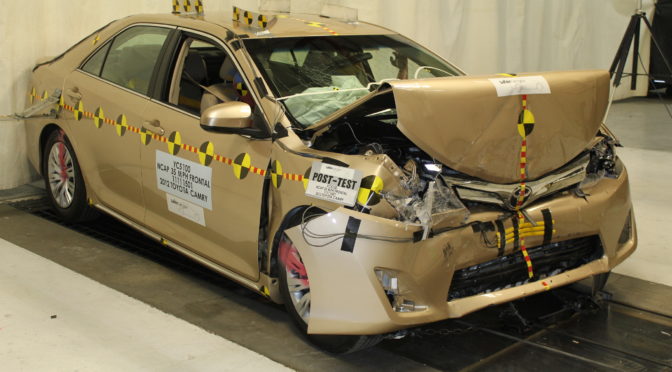
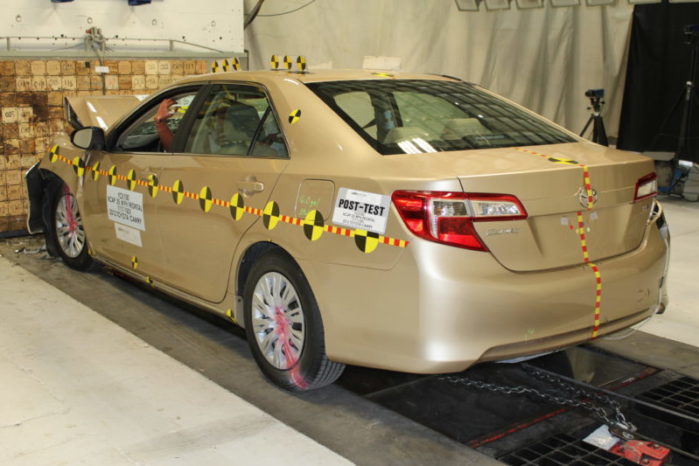
Which is Safer, the Camry or Accord? The Answer Per IIHS Driver Death Rates (2017)

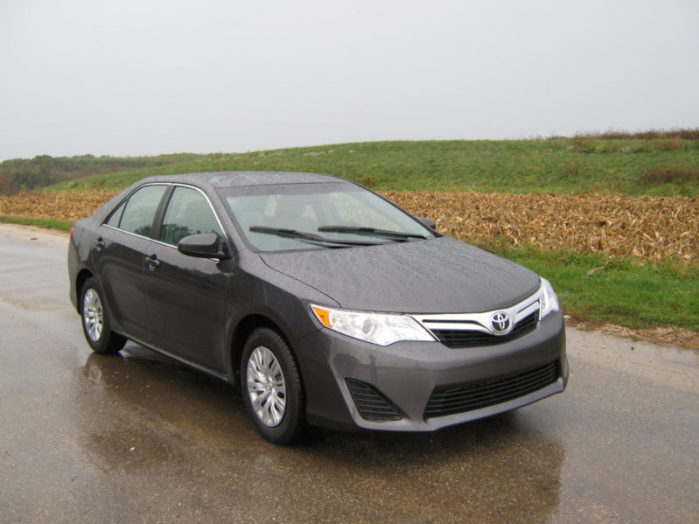
Per the IIHS' 2017 driver death rate math, a Toyota Camry, Honda Accord, and Camry hybrid are equally safe family cars.
Per the IIHS’ 2017 driver death rate math, a Toyota Camry, Honda Accord, and Camry hybrid are equally safe family cars.

The Toyota Camry and Honda Accord are consistently two of the most popular cars sold today in the United States and Canada, and they continue to be two of the most reliable, safe, and frequently-recommended choices for affordable family vehicles in both countries. But is there a difference between the two sedans when it comes to safety? I decided to peer into the IIHS’ most recent batch of driver death rate data to find out.

Every few years, the IIHS releases a set of calculations on driver death rates for recent model year vehicles sold in the US. The calculations are flawed, as a.) they involve large confidence intervals and b.) don’t factor in two thirds of the key features in auto safetyhow we drive and where we drive. But with those limitations, the data are interesting, and can shed light on a number of questions–including whether a Camry is a safer family car than an Accord, or whether the reverse is true.

This is part of an ongoing series digging into the IIHS’ 2017 Status Report (volume 52, number 3); recent articles include The Volt, The Leaf, or The Prius for Safety?, Is a Civic as Safe as an Accord?, Choose the Cruze over the Suburban, and The Outback, Legacy, and Forester Are Equally Safe. Today’s we’ll dig into whether there’s actually a clear safety difference between a recent year Camry and a recent year Accord.

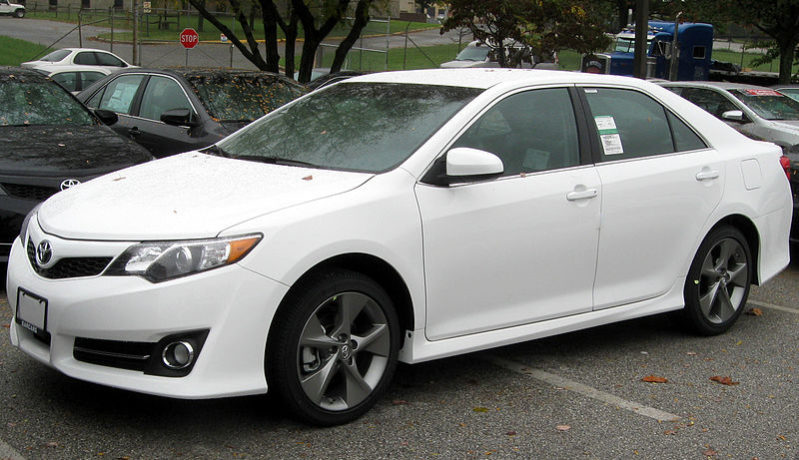
2012-2014 Toyota Camry – 39 driver deaths (29-49)

According to the IIHS, the Toyota Camry’s driver death rate between model years 2012 and 2014 was 39, with 23 predicted fatalities occurring from multiple vehicle collisions and 17 from single vehicle crashes, with 6 of those resulting from rollovers. Astute readers may note that 23 and 17 sum to 40, not 39; this is likely due to rounding errors. Remember that the “39” figure doesn’t mean that 39 people died while driving 2012 to 2014 model year Camrys during the surveyed years. Rather, it means that the IIHS looked at NHTSA FARS data on who died driving Camrys of the aforementioned model years between 2012 and 2015, crossed it with IHS data on how many Camrys were registered, and extrapolated the figures with a statistical software package. The “39” is their prediction of how many drivers would die if, say, 1 million drove 1 million of the aforementioned Camrys for a full year throughout the United States. This exposure was based on 2,256,106 registered vehicle years.

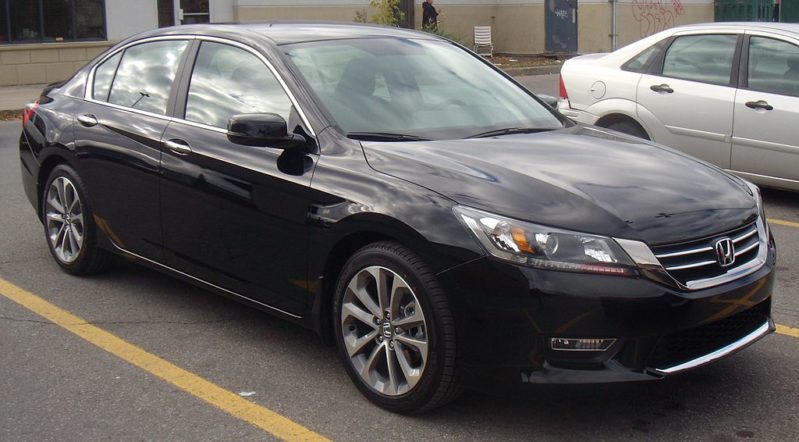
2013-2014 Honda Accord – 36 driver deaths (22-50)

In a statistical tie with the Camry, the 2013-2014 Honda Accord had a driver death rate of 36, with 21 predicted fatalities occurring from multiple vehicle collisions and 16 from single vehicle crashes, with 9 of those resulting from rollovers. As with the Camry, adding multiple- and single-vehicle crash estimates doesn’t equal the combined driver death rate figure; we’ll have to make our peace with this. As with the Camry, the figure roughly means that, per the IIHS’ calculations, if 500,000 drivers drove 500,000 Accords for 2 full years throughout the United States (at typical miles and highway/city driving patterns), we would expect 36 of them to die.The exposure was based on 1.001,344 registered vehicle years.

Although it’s not a sedan, it’s worth noting that the Accord coupe had a driver death rate of 20 (with all 20 predicted fatalities occurring in multiple-vehicle collisions).  It’s also worth noting that, as we established in a previous article in this series, the Accord sedan had a driver death rate statistically indistinguishable from that of the much smaller Civic sedan.

2012-2014 Toyota Camry hybrid – 25 driver deaths (4-46)

Because the IIHS occasionally publishes driver death rate data for the Camry hybrid, let’s take a look at it too. Per their figures, the 2012-2014 Camry hybrid had a driver death rate of 25, with 22 predicted multiple-vehicle fatalities and 3 single-vehicle fatalities, none of which would occur from rollovers.  This figure was based on 262,129 registered vehicle years, and it again suggests that, per the IIHS’ math, if 1 million Camry hybrid drivers drove their vehicles for a full year, we’d expect 25 of them to die in motor vehicle crashes while driving.

So was the Camry Hybrid safest, followed by the Accord and regular Camry?

It would appear to be the case, but…it wasn’t.

Statistically speaking, there was no difference between the three vehicles in their abilities to keep their drivers alive. Let’s go into why below.

To put it simply, the confidence bounds of all three vehicles overlapped. The 95% confidence bounds provided an estimate of where we’d find the true driver death rate 95% of the time we took a sample from the car and driver pool (e.g., 1 million drivers driving 1 million Camrys for a year, or 2 million drivers driving 2 million Accords for 6 months). The Camry’s true driver death rate, per the model, would almost always fall between 29 and 49. The Accord’s? Between 22 and 50. The Camry hybrid’s? Between 4 and 46. In other words, there’s a chance (29-49, or 21, out of 4-46, or 43) of 21/43, or 49%, that all three vehicles shared the same true driver death rate. It’s possible the Camry’s rate was truly lowest, or that of the Accord, or that of the Camry hybrid. But we just don’t know, and we can’t statistically prove that one of the three actually had the lowest driver death rate based on the IIHS’ math. Or to put it another way, there’s no way to statistically prove that any differences observed did not occur simply due to chance.

As a footnote, the Accord coupe, with its driver death rate of 20, was also not significantly safer than any of the aforementioned vehicles; it had an exposure of 101,516 registered vehicle years and as a result a very, very wide confidence bound of 2-71. That encompasses all of the aforementioned vehicles and makes it statistically indistinguishable from any of them in safety.

Does this mean that my husband, wife, kids, or family would be equally safe in any kind of Camry or Accord?

Per the IIHS’ math, yes. The truth is that all four vehicles are very safe, as they include the same core safety features (i.e., good frontal and side crash scores, side airbags with head protection, and ESC). While the IIHS only looked at driver data, it’s also likely the vehicles would provide comparable levels of passenger protection as they did for their respective drivers. A modern Camry is a good family vehicle; so is a modern Accord (although I’d recommend the sedan over the coupe since the sedan has far more front-to-back space for Accord car seat installations. If you or your loved ones get to drive any of these vehicles, your survival will have far more to do with how and where you’re driving than on which vehicle you chose–which, statistically speaking, won’t make any difference at all.

What’s the most important thing to remember to keep my family safe in a Camry, Accord, or similar mid-sized sedan?

If you already drive one of these vehicles, or even if you drive something completely different, most of the safety of your loved ones will depend on the degree to which you respect the three following rules: Choose safe speeds, follow best practices with car seats,  and choose safe roads. Live these principles and you will raise your family’s chances of both staying out of and surviving car crashes by far more than you will by choosing any vehicle on any car lot in the country.

If you find the information on car safety, recommended car seats, and car seat reviews on this car seat blog helpful, you can shop through this Amazon link for any purchases, car seat-related or not. Canadians can shop through this link for Canadian purchases.

Which is the Safest Subaru: Outback, Legacy, or Forester? IIHS Driver Death Rates

Per the IIHS' 2017 driver death rate math, a Subaru Outback isn't any safer than a Legacy or Forester--they're all just really safe vehicles.
Per the IIHS’ 2017 driver death rate math, a Subaru Outback isn’t any safer than a Legacy or Forester–they’re all just really safe vehicles.

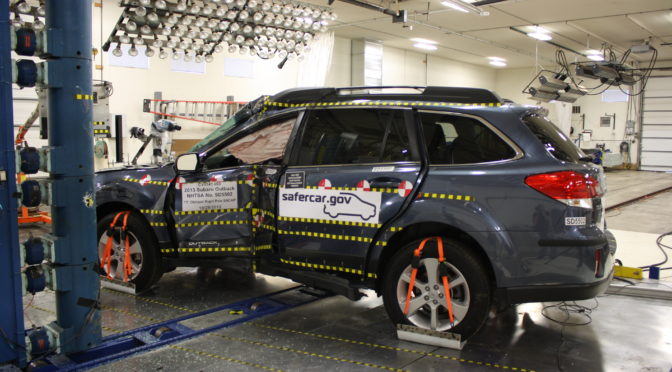
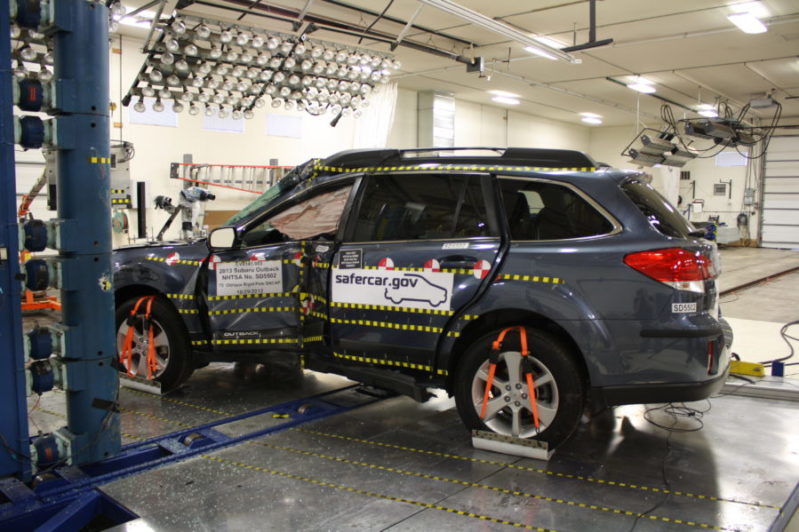
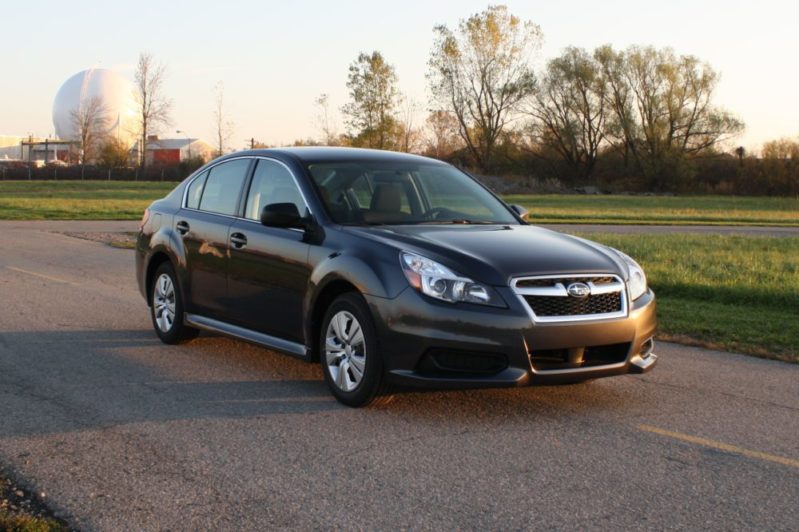
Subarus have a reputation for safety among middle-to-upper class educated car buyers, and it’s not hard to see why: their flagship wagon, sedan, and SUV, the Outback, Legacy, and Forester, constantly land on the IIHS’ “top safety pick” lists year after year.

However, the ultimate question of vehicle safety doesn’t have to do with how vehicles test in controlled crashes, but with how they actually protect drivers and passengers on the daily bloodbath that is the US road network. If you’re up for crunching NHTSA FARS data, you can pull the figures yourself, but if you’re short on time, the IIHS periodically runs their own calculations and publishes lists of driver death rates for recently sold new vehicles. I enjoy reviewing the data, even though it involves a.) large margins of error and b.) overlooks two thirds of what’s most important in auto safety–road design and driver behavior.

This is part of a series on the IIHS’ summer 2017 Status Report (volume 52, number 3); previous articles include what’s the safest electric / hybrid: the Volt, the Leaf, or the Prius?, Civic vs Accord safety showdown, and my Cruze is as safe as your Suburban. Today we’ll look at whether or not there’s a safety difference between the sales-leading Subaru Outback, its sedan equivalent Subaru Legacy, and the SUV / CUV Subaru Forester.

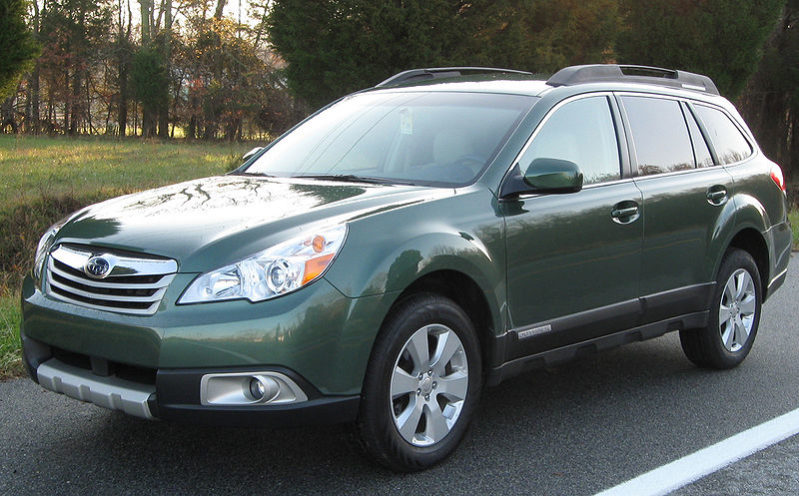
2011-2014 Subaru Outback – 12 driver deaths (5-20)

Per the IIHS, the Subaru Outback’s estimated driver death rate during the 2011-2014 model years was 12, with 8 of those deaths predicted to occur during multiple vehicle crashes, 3 from single vehicle crashes, and 1 of those from a rollover. The exposure came from 1,116, 891 registered vehicle years. As the IIHS notes, a registered vehicle year refers to one vehicle registered for a full year. This basically means that the IIHS took NHTSA FARS data about fatal car crashes and crossed it with IHS vehicle registration data to make a model of driver death estimates. Their calculations essentially state that if 1 million drivers drove 1 million ’11-’14 Outbacks throughout the US for a year, we’d expect 12 of them to die.

2011-2014 Subaru Legacy – 20 driver deaths (4-36)

The Legacy’s estimated driver death rate during the 2011-2014 model years was 20, with 14 estimated to occur from multi-vehicle crashes, 5 from single vehicle crashes, and 4 of those from rollovers. The exposure resulted from 428,322 registered vehicle years, a figure roughly 1/3rd the size of the Outback’s, which resulted in a much larger confidence bound (spanning 33 instead of 16 with the Outback). As with the Outback, it’s important to remember that the figure above doesn’t mean 20 drivers died while driving Legacys; it means that in a sample of 1 million drivers driving 1 million ’11-’14 Legacys for a year, we’d expect 20 of them to die over the year.

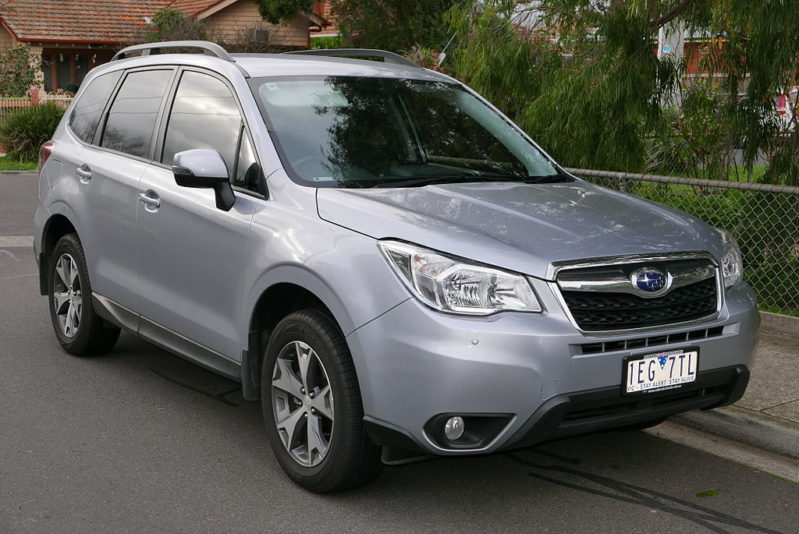
2014 Subaru Forester – 28 driver deaths (3-53)

Finally we come to the Forester. It had the highest estimated rate of driver deaths at 28 for the 2014 model year, with 17 predicted multiple vehicle fatalities and 11 deaths resulting from single vehicle crashes. The exposure was based on 134,402 registered vehicle years, the smallest of the three vehicles, which is why the confidence bound spanned 51 instead of 33 as with the Legacy or 16 as with the Outback. For reference, the smallest exposure figure the IIHS uses for their calculations is 100,000 registered vehicle years. Below that, they likely find the figure either introduces too much error into their models or results in a larger than desirable confidence bound. At any rate, the driver death figure means that if we let 1 million drivers loose with 1 million 2014 Foresters, we’d expect 28 of them to die in the course of a year’s worth of driving throughout the country–in New England, in the MidWest, in the South, and in the West.

Does this mean the Outback is the safest, followed by the Legacy, then the Forester?

Not quite. Although the Outback had the lowest driver death rate, followed by the Legacy’s at 20 and the Forester’s at 18, none of the driver death rates were statistically different from the others. This is where the confidence bounds become important. The 95% confidence bounds give us an estimate of where the true driver death rate would fall 95% of the time when we sampled the car and driver pool (e.g., when we allowed 1 million drivers to drive 1 million of the given vehicles for a year, or 500,000 drivers to drive 500,000 of the vehicles for 2 years).

The Outback’s true driver death rate would, per the model, almost always fall between 5 and 20. The Legacy’s? Between 4 and 36. The Forester’s? Between 3 and 53. In other words, there’s a chance (5-20, or 16, out of 3-53, or 51) of 16/51, or 31%, that all three vehicles share exactly the same driver death rate. There’s a chance that the Outback had the lowest true death rate for drivers, a chance that the title would go to the Legacy, and a chance that it actually belonged to the Forester. The broad point is that there’s no way to statistically prove that any of the three vehicles was safer than the other two based on the IIHS’ calculations. Or to put it even more bluntly, we can’t statistically prove that any differences in the driver death rate weren’t simply due to chance.

Does this mean that my children, husband, wife, or family are equally safe in a Forester, Legacy, and Outback?

Per the calculations of the IIHS, yes. Despite the differences in size and price of the vehicles, their actual driving safety as measured by records of driver fatalities in each vehicle did not show a significant difference in odds of survivability from one vehicle to the next. Keep in mind that the IIHS only surveyed driver data, rather than passenger survival data (including that for children). However, since all three vehicles include the same core safety features (i.e., good frontal and side crash scores, side airbags with head protection, and ESC), each could be expected to provide the same amount of passenger protection as individual driver protection. An Outback is a good choice for a family, but so is a Legacy, and so is a Forester. If you’re lucky enough to drive any of these vehicles, whether you survive or not will depend far more on how and where you drive than on which one you’re driving–which will make, statistically speaking, no difference whatsoever.

What’s the single most important thing I can do to keep my family safe in an Outback / Forester / Legacy (or any other vehicle)?

If you’re already in one of these vehicles, or even if you’re not, you’ll get the lion’s share of protection from simply observing the three following rules: Choose safe speeds, follow best practices with car seats,  and choose safe roads. Do these three things, and you’ll increase your family’s odds of both avoiding and surviving crashes by more than you’d manage through any vehicle choice.

If you find my information on best practices in car and car seat safety helpful, you can do your shopping through this Amazon link. Canadians can shop here for Canadian purchases. Have a question or want to discuss best practices? Join us in the forums!

Small Car Safety: A Chevy Cruze is as Safe as a Chevy Suburban, Per IIHS Driver Death Rates (2017)

Per the IIHS' 2017 driver death rate math, a Chevy Cruze is as safe of a car to drive as a Chevy Suburban, despite being significantly smaller.
Per the IIHS’ 2017 driver death rate math, a Chevrolet Cruze is as safe of a car to drive as a Suburban, despite being significantly smaller.

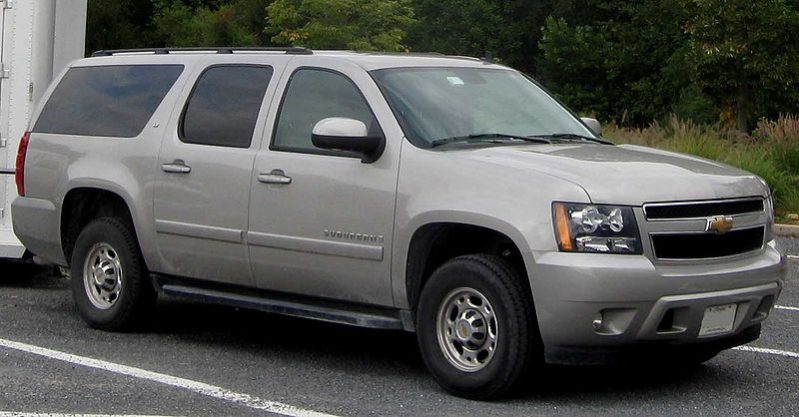
Every few years, the IIHS lets loose calculations on which new vehicles were recently safest and not-so-safe in terms of driver death rates. I enjoy taking a look at the data and fishing out trends. It’s important to remember that a.) there are huge margins of error and b.) vehicle selection is only one third of what’s important in auto safety–the other two being road design and driver behavior. This is part of a series on the IIHS’ summer 2017 Status Report (volume 52, number 3); previous articles include the safest hybrid / electric cars are currently the Volt and Leaf and a Civic is as safe as an Accord. It’s also part of an ongoing series on small car safety; previous articles include how small cars can be safer than the largest SUVs and why we should all drive small cars. Today we’ll look at how the Chevrolet Cruze fared in driver safety compared to the behemoth model-mate Chevrolet Suburban.

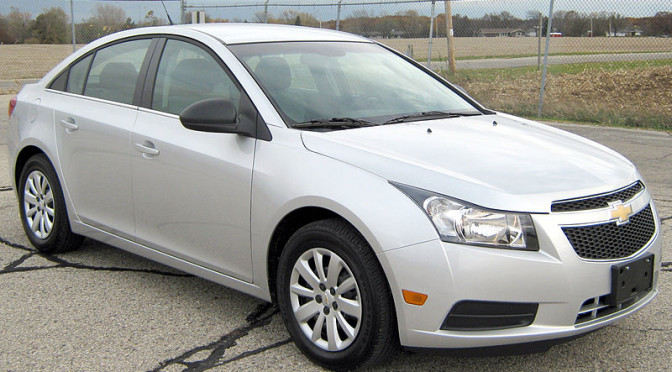
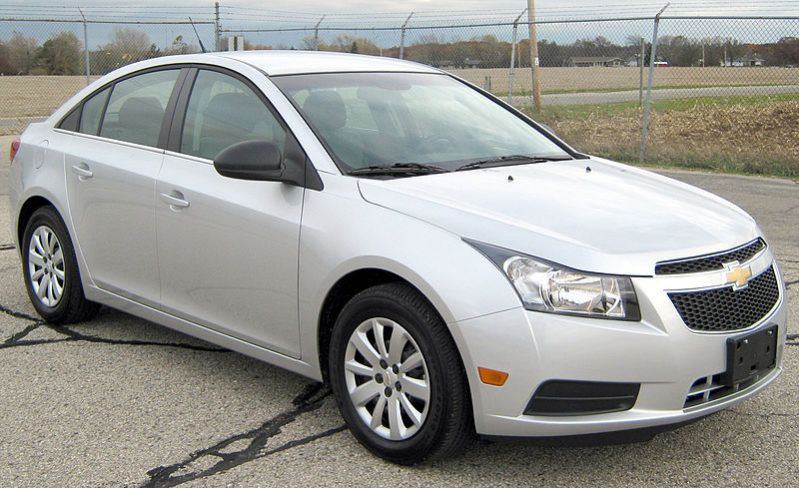
2011-2014 Chevrolet Cruze – 42 driver deaths (32-52)

According to the IIHS, the Chevrolet Cruze’s estimated driver death rate during the 2011-2014 model years was 42, with 29 of those estimated deaths predicted to occur through multiple vehicle collisions, 13 from single vehicle crashes, and 4 of those 13 from rollovers. The exposure was due to 2,220,302 registered vehicle years. What this means is that the IIHS looked at NHTSA data of auto deaths and their data of registered vehicles and made up a model of how many deaths we could expect to see if everyone drove an ’11-’14 Cruze. Their math suggests that if something like 1 million drivers drove 1 million ’11-’14 Chevrolet Cruzes around the US for a full year, we’d expect 42 of them to die. This was almost identical to the figures for both the Civic and the Accord, by the way.

2011-2014 Chevrolet Suburban 1500 4WD – 39 driver deaths (11-67)

In a statistical dead heat with the Cruze, the 2011-2014 model years of the 4WD Chevy Suburban logged a driver death rate of 39. Of these 39 estimated deaths, 23 were predicted to occur from multiple-vehicle collisions, 16 from single vehicle crashes, and 10 of those 16 from rollovers. The confidence bound spanned 11-67 with an exposure of 293,380 registered vehicle years, a figure close to 1/10th the size of the Cruze’s, which resulted in a much larger confidence bound (spanning 56 instead of 20 with the Cruze). As with the Cruze, it’s important to remember that the DDR doesn’t mean that 39 drivers died driving these Suburbans. It means that if 1 million drivers drove 1 million ’11-’14 Suburbans for a full year, 39 would be predicted to die in the course of the year. It’s also important to note that the 2WD version of the Suburban had a much lower driver death rate of 7 (0-38) with 147,811 registered vehicle years of exposure.

How can the Cruze be as safe as the Suburban if it had a higher driver death rate?

Remember the margins of error I discussed at the start of the article? This is where they become relevant. Looking at the numbers, it would seem that the 4WD Suburban was slightly safer to drive than the Cruze in the aforementioned model years due to a DDR of 39 vs a DDR of 42. However, the single number isn’t what makes the difference; the confidence bounds provide the context, and context is important.

The 95% confidence bounds give an idea of where the true driver death rate would occur in 95% of samplings (e.g., situations where 1 million drivers drove 1 million of the given vehicles for a year). The Cruze’s bounds (32-52) and the 4WD Suburban’s (11-67) overlapped a lot. Specifically, the Suburban’s confidence bound encompassed the entire range for the Cruze. There’s no way, statistically-speaking, to say that either vehicle was actually safer than the other based on the IIHS’ calculations. To put it another way, we can’t statistically state that any DDR difference wasn’t due to chance.

What about the 2WD Suburban?  Wouldn’t that be safer than the Cruze?

It’s possible, but it’s still impossible to say given the confidence bounds. Because the confidence bounds of the 2WD Suburban (0-38) still partially overlap with those of the Cruze (32-52), we can’t state that there was a statistically significant difference between the driver death rates of both vehicles. Once again, it’s possible that the difference in DDRs could have occurred purely due to chance. The overlap was much smaller (32-38, or 7 out of 52), suggesting only a 13% chance that they shared the same true DDR. But as long as that chance exists–as long as there’s any overlap–the two vehicles were not statistically different in driver safety. To this end, it’s worth keeping in mind that in the last DDR Status Report (Volume 50, No. 1 in January 29, 2015), the 2011 Cruze had a lower DDR at 42 than the 2WD 2008-2011 Suburban at 60. This is a quick example of how wildly the statistics can swing from one survey to the next with essentially the same vehicles, and why it’s so important not to take the single DDR number as gospel.

How about the 2WD Suburban vs the 4WD Suburban?

As with the 2WD Suburban vs the Cruze, it’s possible the difference in DDRs between the 2WD and 4WD Suburban could be completely due to chance. This also applies to the differences between the 2WD Suburban (0-38) and the 4WD Suburban (11-67). It doesn’t mean the 2WD was actually a safer vehicle than the 4WD. In fact, it’s rather common to see 4WD and 2WD vehicles of the same make and model trade places from one DDR Status Report to the next. In fact, in the last DDR Status Report (Volume 50, No. 1 in January 29, 2015), the 2008-2011 4WD Suburban had a DDR of 17 (0-34) while the 2WD had a DDR of 60 (13-107). The results were completely reversed, even though one of the model years (2011) was the same from one study to the next and the Suburban didn’t see any major design changes in the full span of those years (2008-2014). Most importantly, the confidence bounds overlapped handily and there was still no statistically significant difference between the two vehicles.

Does this mean my son, daughter, husband, wife, children, and family are as safe in a Cruze as in a Suburban?

Statistically speaking, yes. Although the Suburban (2WD or 4WD) is a much larger and expensive vehicle than the Cruze, the actual driving safety as measured by the records of who lived and died driving them didn’t reveal a significant difference in survivability probabilities between the two vehicles. It’s important to remember that the IIHS only looked at driver data, and not survival data for passengers (including children). However, since both vehicles are equipped with the same essential safety features (i.e., good frontal and side crash scores, side airbags with head protection, and ESC), they would likely protect their passengers the same way they did their drivers. A Cruze is a safe family car. A Suburban is a safe, if difficult to drive and fuel-inefficient, family SUV. Vehicles in the US are safe enough; the deaths primarily occur due to how and where we’re driving them.

What can I do to keep my loved ones safe in either (or any) vehicle?

Regardless of what you’re driving, it’s important to remember that vehicle safety only makes up one of the three components tied to auto safety. What make a far greater difference are how you drive and where you drive. Fortunately, driving safely and choosing safe infrastructure doesn’t take money; they just take good judgment. Choose safe speeds, follow best practices with car seats,  and choose safe roads, and your family’s odds of being in a crash (or not surviving one) will be much lower than those you’d find from choosing any vehicle, no matter how much it cost.

If you find the information on car safety, recommended car seats, and car seat reviews on this car seat blog helpful, you can shop through this Amazon link for any purchases, car seat-related or not. Canadians can shop through this link for Canadian purchases.

Small Car Safety: A Honda Civic is as Safe as a Honda Accord, Per IIHS Driver Death Rates (2017)

Per the IIHS' 2017 driver death rate math, a Honda Civic is as safe of a car to drive as a Honda Accord, despite being significantly smaller.
Per the IIHS’ 2017 driver death rate math, a Honda Civic is as safe of a car to drive as a Honda Accord, despite being significantly smaller.

The IIHS recently released another round of calculations on the safest new vehicles by driver death rates. As always, I enjoy digging into the data and looking for trends. I do this with the standard disclaimers that a.) the margins of error are huge, and b.) vehicle safety is only one of three key components to auto best practices (the other two being driver behaviors and road and societal design). I recently wrote about how the Chevy Volt and Nissan Leaf were two of the safest electric / hybrid cars and two of the safest vehicles overall per the most recent DDR data available from the IIHS’ summer 2017 Status Report (volume 52, number 3). Last year I wrote about how the Toyota Prius was safer than a Chevy Tahoe, F-150 Super 4WD, and Toyota Sienna. Today we’ll take a look at how the Honda Civic fared in driver safety compared to its larger sibling, the Honda Accord.

2012-2014 Honda Civic (sedan)– 39 driver deaths (28-49)

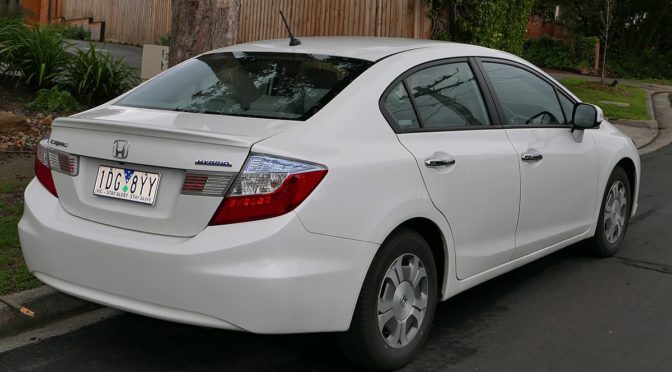
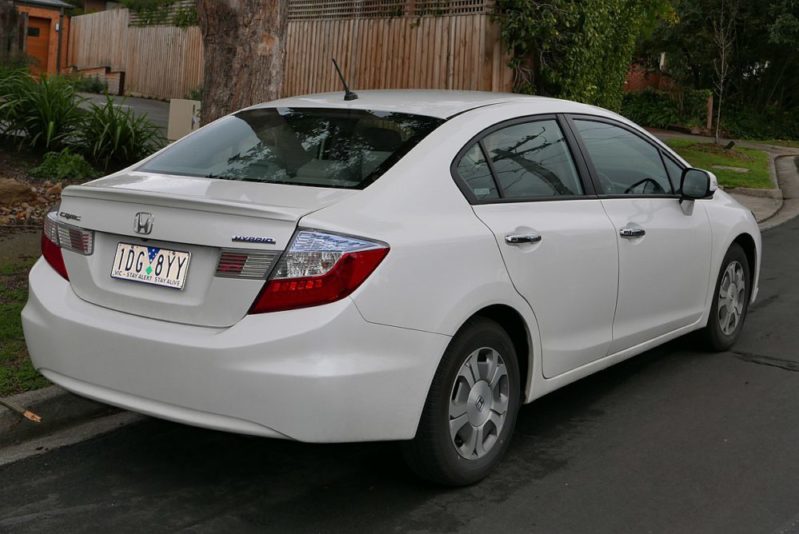
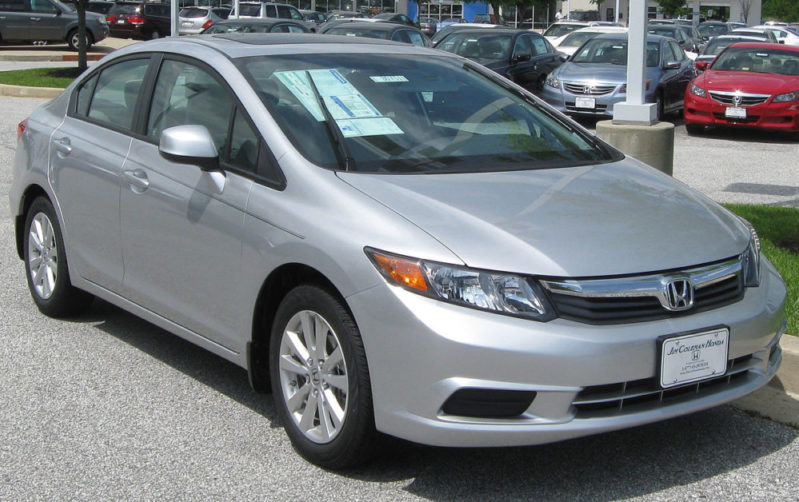
Per the IIHS, the estimated driver death rate during the 2012-2014 model years of the Honda Civic sedan was 39 with 27 of those deaths predicted to occur from multiple-vehicle collisions and 11 from single vehicle crashes, with 2 of those 11 crashes due to rollovers. The exposure came from 1,875,054 registered vehicle years. Essentially, the IIHS analyzed NHTSA records of vehicle deaths and IHS data of vehicle registrations and came up with a statistical model of how many fatalities one would expect from a certain number of drivers behind the wheels of ’12-’14 Civics. Per their calculations, if something like 1 million drivers drove 1 million ’12-’14 Honda Civics around the US for a year, we’d expect only 39 of them to die. It is noteworthy that the DDR for the coupe was only 10 with 7 multiple-vehicle deaths, 3 single vehicle deaths, an exposure of 286,756 registered vehicle years, and a confidence bound of 2-31.

2013-2014 Honda Accord (sedan) – 36 driver deaths (22-50)

In a statistically identical position to the Civic, we find the 2013-2014 Honda Accord sedan with a driver death rate of 36. Of those 36 estimated deaths, 21 were predicted to occur from multiple-vehicle collisions while 16 were predicted to occur through single vehicle crashes, with 9 of those 16 occurring during rollovers. The exposure came from 1,001,344 registered vehicle years, a slightly smaller figure than that of the Civic, which resulted in a larger confidence bound (spanning 28 instead of 21 with the Civic). As with the Civic, it’s important to note that the DDR does not mean that 36 drivers died driving that model range of the Accord. Rephrasing IIHS speak, the calculations mean that if 1 million drivers drove 1 million ’13-’14 Accords for a year, we’d expect 36 of them to die. It is noteworthy again to provide the coupe comparison numbers; here, the coupe Accord had a driver death rate of 20, with all 20 predicted deaths occurring in multiple vehicle collisions and an exposure of 101,5016 and confidence bound of 2-71.

How can the Civic be as safe as the Accord if it had a higher driver death rate?

This is where the margins of error I mentioned at the start of this article come into play. Although at first glance it would appear that the Accord sedan was a slightly safer vehicle to drive during the aforementioned model years than the Civic sedan due to a DDR of 36 vs a DDR of 39, we can’t just look at the single number; the confidence bounds provide a greater and ultimately more important context.

The 95% confidence bounds roughly describe the ranges in which we’d expect the true driver death rate to occur in 95% of samplings (scenarios with 1 million drivers driving the 1 million vehicles for one year). The Civic sedan’s bounds (28-49) and the Accord’s (22-50) overlapped significantly; only 22-27 and 50 did not, or 7/29, or 24%. This means there was a 76% chance both vehicles shared the same true driver death rate. So while it’s possible one vehicle was actually safer than the other, the odds are much greater that the differences in the DDRs were simply due to chance. In fact, statistically, we can’t say that the differences weren’t due to chance.

Does this mean a Civic is as safe of a vehicle for my son/daughter/husband/wife/children/family as an Accord?

In a word, yes. Despite the Accord being a larger and more expensive vehicle than the Civic, in actual driving safety as measured by the most accurate and ultimately important tests we have–records of who lived and who died on the roads–there wasn’t a significant difference in survivability between the two vehicles. It’s important to note that the IIHS only examined driver data, rather than data for any passengers (including children). However, given the fact that both vehicles have the same core safety features (i.e., good frontal and side crash scores, side airbags with head protection, and ESC), it’s likely they’d provide the same protection to passengers as they did to their drivers. A Civic is a great family vehicle. An Accord is a great family vehicle. We’ve long reached the point in the US where the vehicles themselves are safe enough; what’s lacking is how we’re driving them and where.

How do I keep my family safe, regardless of which vehicle I’m driving?

Remember that vehicle safety is only one third of the three factors that lead to auto safety. Driving safely and driving on safe infrastructure will make far more of a difference than vehicular choice, and neither of those options cost money; they just require good judgment. Choose safe speeds, follow best practices with car seats,  and choose safe roads, and you’ll reduce your odds of your family’s involvement in a crash (and increase your odds of your family’s surviving a crash) more than you will by choosing any vehicle at any price.

It’s much harder to drive safely on a consistent basis by following best practices than it is to simply hope for the best by choosing a newer vehicle, but there isn’t a vehicle on the market that will compensate for poor driving or for poor infrastructure, and we have the ability to cut our risks of death immensely each time we get into our vehicles by simply driving the way the way we would if we were trying to earn our driver’s license–every single time we turned the key.

If you find the information on car safety, recommended car seats, and car seat reviews on this car seat blog helpful, you can shop through this Amazon link for any purchases, car seat-related or not. Canadians can shop through this link for Canadian purchases.

35,000 Americans will die this year on the road. You don't have to be one of them. A car seat and car safety blog to promote best practices for families.